
Page 241 - Handbook of Materials Failure Analysis
P. 241
5 Examples of Serious Failures of Water Supply and Wastewater 237
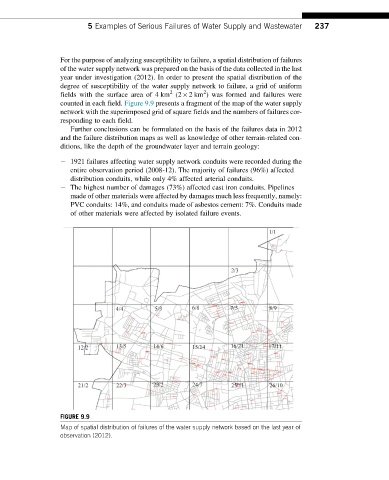
For the purpose of analyzing susceptibility to failure, a spatial distribution of failures
of the water supply network was prepared on the basis of the data collected in the last
year under investigation (2012). In order to present the spatial distribution of the
degree of susceptibility of the water supply network to failure, a grid of uniform
2
2
fields with the surface area of 4 km (2 2km ) was formed and failures were
counted in each field. Figure 9.9 presents a fragment of the map of the water supply
network with the superimposed grid of square fields and the numbers of failures cor-
responding to each field.
Further conclusions can be formulated on the basis of the failures data in 2012
and the failure distribution maps as well as knowledge of other terrain-related con-
ditions, like the depth of the groundwater layer and terrain geology:
1921 failures affecting water supply network conduits were recorded during the
entire observation period (2008-12). The majority of failures (96%) affected
distribution conduits, while only 4% affected arterial conduits.
The highest number of damages (73%) affected cast iron conduits. Pipelines
made of other materials were affected by damages much less frequently, namely:
PVC conduits: 14%, and conduits made of asbestos cement: 7%. Conduits made
of other materials were affected by isolated failure events.
1/1
2/3
4/4 5/3 6/8 7/5 8/9
12/2 13/5 14/6 15/14 16/21 17/11
21/2 22/3 23/2 24/7 25/11 26/10
FIGURE 9.9
Map of spatial distribution of failures of the water supply network based on the last year of
observation (2012).