
Page 100 - Handbook of Properties of Textile and Technical Fibres
P. 100
Properties of wool 81
100 2.5
Stress at 15% strain (MPa) 60 1.5 Modulus (GPa)
2.0
80
40
1.0
20
0.0
0 0.5
0 50 100 150 200 250
Stress at break (MPa)
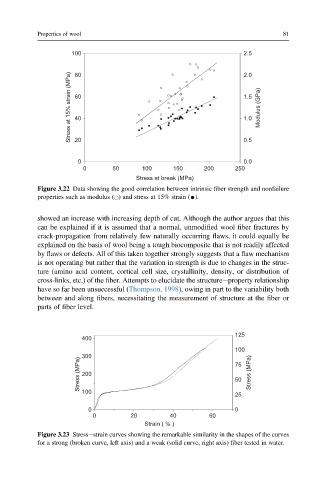
Figure 3.22 Data showing the good correlation between intrinsic fiber strength and nonfailure
properties such as modulus (
) and stress at 15% strain (C).
showed an increase with increasing depth of cut. Although the author argues that this
can be explained if it is assumed that a normal, unmodified wool fiber fractures by
crack-propagation from relatively few naturally occurring flaws, it could equally be
explained on the basis of wool being a tough biocomposite that is not readily affected
by flaws or defects. All of this taken together strongly suggests that a flaw mechanism
is not operating but rather that the variation in strength is due to changes in the struc-
ture (amino acid content, cortical cell size, crystallinity, density, or distribution of
cross-links, etc.) of the fiber. Attempts to elucidate the structureeproperty relationship
have so far been unsuccessful (Thompson, 1998), owing in part to the variability both
between and along fibers, necessitating the measurement of structure at the fiber or
parts of fiber level.
125
400
100
300 75
Stress (MPa) 200 50 Stress (MPa)
100
0
0 25
0 20 40 60
Strain ( % )
Figure 3.23 Stressestrain curves showing the remarkable similarity in the shapes of the curves
for a strong (broken curve, left axis) and a weak (solid curve, right axis) fiber tested in water.