
Page 37 - Handbook of Properties of Textile and Technical Fibres
P. 37
18 Handbook of Properties of Textile and Technical Fibres
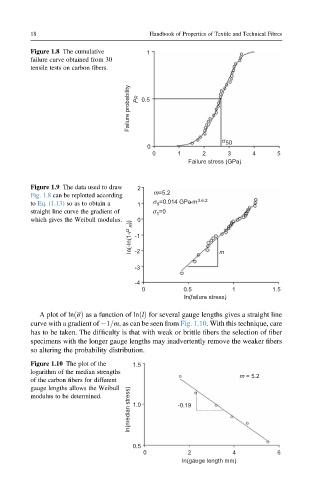
Figure 1.8 The cumulative 1
failure curve obtained from 30
tensile tests on carbon fibers.
Failure probability PR 0.5
σ 50
0
0 1 2 3 4 5
Failure stress (GPa)
Figure 1.9 The data used to draw 2
Fig. 1.8 can be replotted according m=5.2
to Eq. (1.13) so as to obtain a 1 σ =0.014 GPa•m 3.6.2
0
straight line curve the gradient of σ =0
1
which gives the Weibull modulus. 0
In(-In(1-P R )) -1
-2
-3 m
-4
0 0.5 1 1.5
In(failure stress)
A plot of lnðsÞ as a function of lnðlÞ for several gauge lengths gives a straight line
curve with a gradient of 1=m, as can be seen from Fig. 1.10. With this technique, care
has to be taken. The difficulty is that with weak or brittle fibers the selection of fiber
specimens with the longer gauge lengths may inadvertently remove the weaker fibers
so altering the probability distribution.
Figure 1.10 The plot of the 1.5
logarithm of the median strengths
m = 5.2
of the carbon fibers for different
gauge lengths allows the Weibull
In(median stress) 1.0 -0.19
modulus to be determined.
0.5
0 2 4 6
In(gauge length mm)