
Page 94 - Handbook of Properties of Textile and Technical Fibres
P. 94
Properties of wool 75
30 17.3 19.3
b
25 a
Diameter (μm) 15
20
10
5
0
0 20 40 60 80 100
Distance from tip (mm)
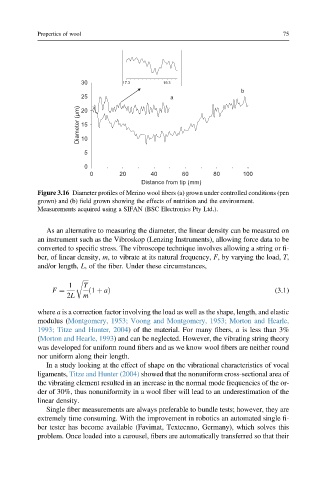
Figure 3.16 Diameter profiles of Merino wool fibers (a) grown under controlled conditions (pen
grown) and (b) field grown showing the effects of nutrition and the environment.
Measurements acquired using a SIFAN (BSC Electronics Pty Ltd.).
As an alternative to measuring the diameter, the linear density can be measured on
an instrument such as the Vibroskop (Lenzing Instruments), allowing force data to be
converted to specific stress. The vibroscope technique involves allowing a string or fi-
ber, of linear density, m, to vibrate at its natural frequency, F, by varying the load, T,
and/or length, L, of the fiber. Under these circumstances,
r ffiffiffiffi
1 T
F ¼ ð1 þ aÞ (3.1)
2L m
where a is a correction factor involving the load as well as the shape, length, and elastic
modulus (Montgomery, 1953; Voong and Montgomery, 1953; Morton and Hearle,
1993; Titze and Hunter, 2004) of the material. For many fibers, a is less than 3%
(Morton and Hearle, 1993) and can be neglected. However, the vibrating string theory
was developed for uniform round fibers and as we know wool fibers are neither round
nor uniform along their length.
In a study looking at the effect of shape on the vibrational characteristics of vocal
ligaments, Titze and Hunter (2004) showed that the nonuniform cross-sectional area of
the vibrating element resulted in an increase in the normal mode frequencies of the or-
der of 30%, thus nonuniformity in a wool fiber will lead to an underestimation of the
linear density.
Single fiber measurements are always preferable to bundle tests; however, they are
extremely time consuming. With the improvement in robotics an automated single fi-
ber tester has become available (Favimat, Textecnno, Germany), which solves this
problem. Once loaded into a carousel, fibers are automatically transferred so that their