
Page 92 - Handbook of Properties of Textile and Technical Fibres
P. 92
Properties of wool 73
160
Initial slope (cN/tex) 120
80
40
0
0 2 4 6 8 10
(%)
CV GL
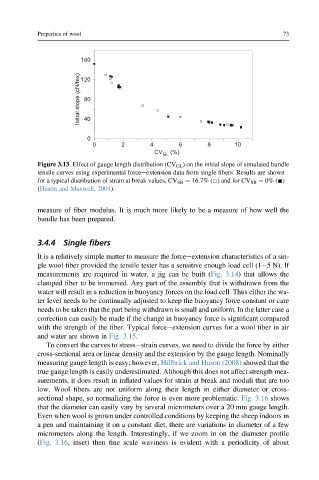
Figure 3.13 Effect of gauge length distribution (CV GL ) on the initial slope of simulated bundle
tensile curves using experimental forceeextension data from single fibers. Results are shown
for a typical distribution of strain at break values, CV SB ¼ 16.7% (,) and for CV SB ¼ 0% (-)
(Huson and Maxwell, 2004).
measure of fiber modulus. It is much more likely to be a measure of how well the
bundle has been prepared.
3.4.4 Single fibers
It is a relatively simple matter to measure the forceeextension characteristics of a sin-
gle wool fiber provided the tensile tester has a sensitive enough load cell (1e5 N). If
measurements are required in water, a jig can be built (Fig. 3.14) that allows the
clamped fiber to be immersed. Any part of the assembly that is withdrawn from the
water will result in a reduction in buoyancy forces on the load cell. Thus either the wa-
ter level needs to be continually adjusted to keep the buoyancy force constant or care
needs to be taken that the part being withdrawn is small and uniform. In the latter case a
correction can easily be made if the change in buoyancy force is significant compared
with the strength of the fiber. Typical forceeextension curves for a wool fiber in air
and water are shown in Fig. 3.15.
To convert the curves to stressestrain curves, we need to divide the force by either
cross-sectional area or linear density and the extension by the gauge length. Nominally
measuring gauge length is easy; however, Hillbrick and Huson (2008) showed that the
true gauge length is easily underestimated. Although this does not affect strength mea-
surements, it does result in inflated values for strain at break and moduli that are too
low. Wool fibers are not uniform along their length in either diameter or cross-
sectional shape, so normalizing the force is even more problematic. Fig. 3.16 shows
that the diameter can easily vary by several micrometers over a 20 mm gauge length.
Even when wool is grown under controlled conditions by keeping the sheep indoors in
a pen and maintaining it on a constant diet, there are variations in diameter of a few
micrometers along the length. Interestingly, if we zoom in on the diameter profile
(Fig. 3.16, inset) then fine scale waviness is evident with a periodicity of about