
Page 87 - Handbook of Properties of Textile and Technical Fibres
P. 87
68 Handbook of Properties of Textile and Technical Fibres
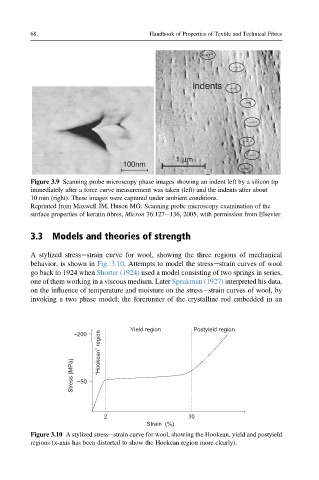
Figure 3.9 Scanning probe microscopy phase images showing an indent left by a silicon tip
immediately after a force curve measurement was taken (left) and the indents after about
10 min (right). These images were captured under ambient conditions.
Reprinted from Maxwell JM, Huson MG: Scanning probe microscopy examination of the
surface properties of keratin fibres, Micron 36:127e136, 2005, with permission from Elsevier.
3.3 Models and theories of strength
A stylized stressestrain curve for wool, showing the three regions of mechanical
behavior, is shown in Fig. 3.10. Attempts to model the stressestrain curves of wool
go back to 1924 when Shorter (1924) used a model consisting of two springs in series,
one of them working in a viscous medium. Later Speakman (1927) interpreted his data,
on the influence of temperature and moisture on the stressestrain curves of wool, by
invoking a two phase model; the forerunner of the crystalline rod embedded in an
Yield region Postyield region
region
~200
Stress (MPa) ~50 “Hookean”
2 30
Strain (%)
Figure 3.10 A stylized stressestrain curve for wool, showing the Hookean, yield and postyield
regions (x-axis has been distorted to show the Hookean region more clearly).