
Page 279 - High Temperature Solid Oxide Fuel Cells Fundamentals, Design and Applications
P. 279
2 56 High Temperature Solid Oxide Fuel Cells: Fundamentals, Design and Applications
-2 -1 0
log( f iHz)
b)
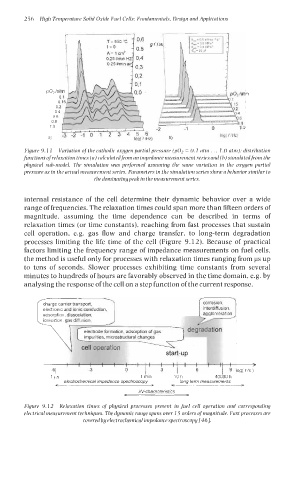
Figure 9.1 1 Variation of the cathodic oxygen partial prrssure (p02 = 0.1 atm . . . 1 .O atm): distribution
Junctions of relaxation times (a) calculated from an impedance measurement series and (b) simulatedfrom the
physical sub-model. The simulation was performed assuming the same variation in the oxygen partial
pressure as in the actual measurement series. Parameters in the simulation series show a behavior similar to
the dominatingpeak in the measurement series.
internal resistance of the cell determine their dynamic behavior over a wide
range of frequencies. The relaxation times could span more than fifteen orders of
magnitude, assuming the time dependence can be described in terms of
relaxation times (or time constants), reaching from fast processes that sustain
cell operation, e.g. gas flow and charge transfer, to long-term degradation
processes limiting the life time of the cell (Figure 9.12). Because of practical
factors limiting the frequency range of impedance measurements on fuel cells,
the method is useful only for processes with relaxation times ranging from ps up
to tens of seconds. Slower processes exhibiting time constants from several
minutes to hundreds of hours are favorably observed in the time domain, e.g. by
analysing the response of the cell on a step function of the current response.
start- -UP
I I I I,
1 PS 1 min 10 h 40000 h
electrochemical impedance spectroscopy long term measurements
< > c >
W-characteristics
Figure 9.12 Relaxation times of physical processes present in fuel cell operation and corresponding
electrical measurement techniques. The dynamic range spans over 15 orders of magnitude. Fast processes are
covered by electrochemical impedance spectroscopy 1461.