
Page 278 - High Temperature Solid Oxide Fuel Cells Fundamentals, Design and Applications
P. 278
Electrode Polarisations 2 5 5
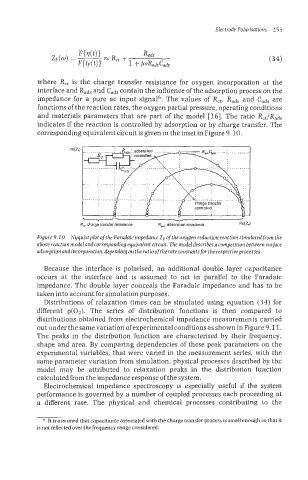
where RCt is the charge transfer resistance for oxygen incorporation at the
interface and Rads and Cads contain the influence of the adsorption process on the
impedance for a pure ac input signal6. The values of Ret, Rads and Cads are
functions of the reaction rates, the oxygen partial pressure, operating conditions
and materials parameters that are part of the model [16]. The ratio &/Rads
indicates if the reaction is controlled by adsorption or by charge transfer. The
corresponding equivalent circuit is given in the inset in Figure 9-10.
--
w
Rd: charge transfer resistance R,; adsorption resistance /
RGJ
Figure 9. IO Xyquistplot of the Faradaic impedance 2, of the oxygen reduction reaction simulated from the
above reaction model and corresponding equivalent circuit. The model describes a competition between surface
adsorption andincorporation. depending on the ratio of the rate constants for the respectiveprocesses.
Because the interface is polarised, an additional double layer capacitance
occurs at the interface and is assumed to act in parallel to the Faradaic
impedance. The double layer conceals the Faradaic impedance and has to be
taken into account for simulation purposes.
Distributions of relaxation times can be simulated using equation (34) for
different ~(0~). The series of distribution functions is then compared to
distributions obtained from electrochemical impedance measurements carried
out under the same variation of experimental conditions as shown in Figure 9.1 1.
The peaks in the distribution function are characterised by their frequency,
shape and area. By comparing dependencies of these peak parameters on the
experimental variables, that were varied in the measurement series, with the
same parameter variation from simulation, physical processes described by the
model may be attributed to relaxation peaks in the distribution function
calculated from the impedance response of the system.
Electrochemical impedance spectroscopy is especially useful if the system
performance is governed by a number of coupled processes each proceeding at
a different rate. The physical and chemical processes contributing to the
It is assumed that capacitance associated with the charge transfer process is small enough so that it
is not reflected over the frequency range considered.