
Page 327 - High Temperature Solid Oxide Fuel Cells Fundamentals, Design and Applications
P. 327
Cell, Stack and System Modelling 303
As discussed above, the I-V relation of a PEN element depends on material
properties and electrode structures as well as on operating parameters such as
gas composition, pressure, and temperature. Using a simple first-order
electrochemical model and the potential balance, Eq. (7), combined with
simplified expressions for the various polarisation contributions such as
Eqs. (ga), (lob), and (11)-(14b), I-V curves can be predicted. These predicted
curves may be used to fit experimental I-V data and deduce, from an optimal fit,
certain material and structure properties such as Ri and i,a, which cannot be
measured directly. In cells with sizable electrode area, which tend to have
appreciable fuel and oxidant utilisation, temperature and gas partial pressures
are local quantities dependent on the extent of the electrochemical and chemical
conversion (i.e., the fuel and oxidant utilisations). The electrochemical model
predicting the I-V curve simultaneously yields the current distribution,
temperature distribution. and other quantities of interest.
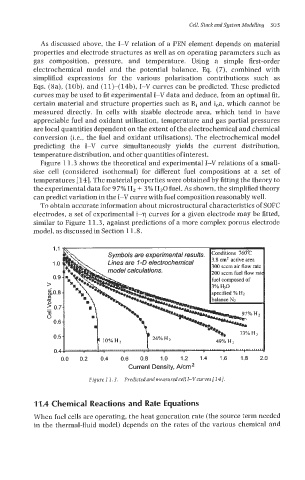
Figure 11.3 shows the theoretical and experimental I-V relations of a small-
size cell (considered isothermal) for different fuel compositions at a set of
temperatures [ 141. The material properties were obtained by fitting the theory to
the experimental data for 9 7% Hz + 3% HzO fuel. As shown, the simplified theory
can predict variation in the I-V curve with fuel composition reasonably well.
To obtain accurate information about microstructural characteristics of SOFC
electrodes, a set of experimental i-q curves for a given electrode may be fitted,
similar to Figure 11.3, against predictions of a more complex porous electrode
model, as discussed in Section 11.8.
1.1
1 .o electrochemical
sccm air flow rate
200 sccm fuel flow rat
0.9
>
d0.8
m
-
I
0
-
2 0.7
01
u
0.6
0.5
0.4
0.0 0.2 0.4 0.6 0.8 1.0 1.2 1.4 1.6 1.8 2.0
Current Density, Nan2
Figure 7 1.3. Predicfedand measlcredcellI-Vcurvesf143.
1’8.4 Chemical Reactions and Rate Equations
Wheo fuel cells are operating, the heat generation rate (the source term needed
in the thermal-fluid model) depends on the rates of the various chemical and