
Page 82 - Human Inspired Dexterity in Robotic Manipulation
P. 82
78 Human Inspired Dexterity in Robotic Manipulation
(A) (B)
(C) (D)
(E) (F)
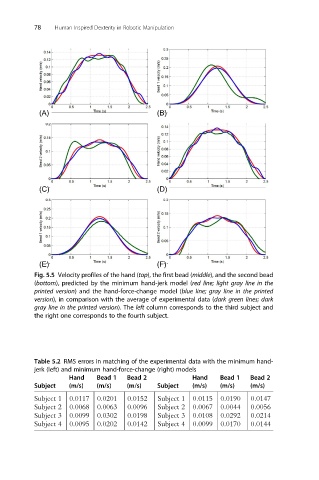
Fig. 5.5 Velocity profiles of the hand (top), the first bead (middle), and the second bead
(bottom), predicted by the minimum hand-jerk model (red line; light gray line in the
printed version) and the hand-force-change model (blue line; gray line in the printed
version), in comparison with the average of experimental data (dark green lines; dark
gray line in the printed version). The left column corresponds to the third subject and
the right one corresponds to the fourth subject.
Table 5.2 RMS errors in matching of the experimental data with the minimum hand-
jerk (left) and minimum hand-force-change (right) models
Hand Bead 1 Bead 2 Hand Bead 1 Bead 2
Subject (m/s) (m/s) (m/s) Subject (m/s) (m/s) (m/s)
Subject 1 0.0117 0.0201 0.0152 Subject 1 0.0115 0.0190 0.0147
Subject 2 0.0068 0.0063 0.0096 Subject 2 0.0067 0.0044 0.0056
Subject 3 0.0099 0.0302 0.0198 Subject 3 0.0108 0.0292 0.0214
Subject 4 0.0095 0.0202 0.0142 Subject 4 0.0099 0.0170 0.0144