
Page 80 - Human Inspired Dexterity in Robotic Manipulation
P. 80
76 Human Inspired Dexterity in Robotic Manipulation
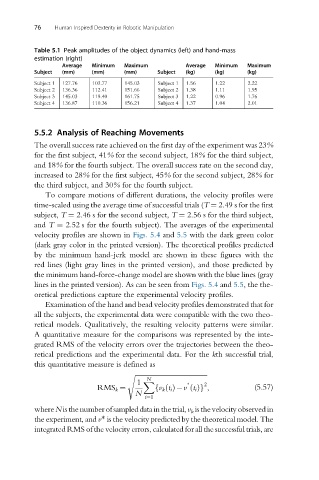
Table 5.1 Peak amplitudes of the object dynamics (left) and hand-mass
estimation (right)
Average Minimum Maximum Average Minimum Maximum
Subject (mm) (mm) (mm) Subject (kg) (kg) (kg)
Subject 1 127.76 103.77 145.03 Subject 1 1.56 1.22 2.22
Subject 2 136.36 112.41 151.66 Subject 2 1.38 1.11 1.95
Subject 3 145.03 119.40 161.75 Subject 3 1.22 0.96 1.76
Subject 4 136.87 110.36 156.21 Subject 4 1.37 1.04 2.01
5.5.2 Analysis of Reaching Movements
The overall success rate achieved on the first day of the experiment was 23%
for the first subject, 41% for the second subject, 18% for the third subject,
and 18% for the fourth subject. The overall success rate on the second day,
increased to 28% for the first subject, 45% for the second subject, 28% for
the third subject, and 30% for the fourth subject.
To compare motions of different durations, the velocity profiles were
time-scaled using the average time of successful trials (T ¼ 2.49 s for the first
subject, T ¼ 2.46 s for the second subject, T ¼ 2.56 s for the third subject,
and T ¼ 2.52 s for the fourth subject). The averages of the experimental
velocity profiles are shown in Figs. 5.4 and 5.5 with the dark green color
(dark gray color in the printed version). The theoretical profiles predicted
by the minimum hand-jerk model are shown in these figures with the
red lines (light gray lines in the printed version), and those predicted by
the minimum hand-force-change model are shown with the blue lines (gray
lines in the printed version). As can be seen from Figs. 5.4 and 5.5, the the-
oretical predictions capture the experimental velocity profiles.
Examination of the hand and bead velocity profiles demonstrated that for
all the subjects, the experimental data were compatible with the two theo-
retical models. Qualitatively, the resulting velocity patterns were similar.
A quantitative measure for the comparisons was represented by the inte-
grated RMS of the velocity errors over the trajectories between the theo-
retical predictions and the experimental data. For the kth successful trial,
this quantitative measure is defined as
s ffiffiffiffiffiffiffiffiffiffiffiffiffiffiffiffiffiffiffiffiffiffiffiffiffiffiffiffiffiffiffiffiffiffiffiffiffiffiffiffiffiffiffi
N
1 X ∗ 2
RMS k ¼ fv k ðt i Þ v ðt i Þg , (5.57)
N
i¼1
whereN isthe numberofsampled data in thetrial, v k is thevelocity observed in
the experiment, and v* is the velocity predicted by the theoretical model. The
integrated RMS of the velocity errors, calculated for all the successful trials, are