
Page 188 - Hydrocarbon
P. 188
Volumetric Estimation 175
easy’ deterministic method most frequently used to obtain a volumetric estimate.
It can be done on paper or by using available software. The latter is only reliable if
the software is constrained by the geological reservoir model.
7.1.1. The area–depth method
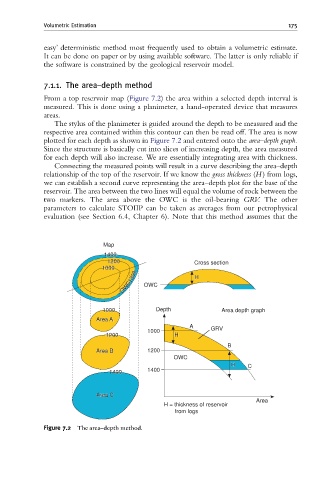
From a top reservoir map (Figure 7.2) the area within a selected depth interval is
measured. This is done using a planimeter, a hand-operated device that measures
areas.
The stylus of the planimeter is guided around the depth to be measured and the
respective area contained within this contour can then be read off. The area is now
plotted for each depth as shown in Figure 7.2 and entered onto the area–depth graph.
Since the structure is basically cut into slices of increasing depth, the area measured
for each depth will also increase. We are essentially integrating area with thickness.
Connecting the measured points will result in a curve describing the area–depth
relationship of the top of the reservoir. If we know the gross thickness (H ) from logs,
we can establish a second curve representing the area–depth plot for the base of the
reservoir. The area between the two lines will equal the volume of rock between the
two markers. The area above the OWC is the oil-bearing GRV. The other
parameters to calculate STOIIP can be taken as averages from our petrophysical
evaluation (see Section 6.4, Chapter 6). Note that this method assumes that the
Map
1400
1400
1200 Cross section
1200
1000
1000
OWC1300 OWC H H
OWC1300
1000
1000 Depth Area depth graph
Area A A
Area
A
1000 GRV
1200
1200 H H
B
Area B B 1200
Area
OWC
H H C
1400
1400
1400
Area
Area C
C
Area
H = thickness of reservoir
from logs
Figure 7.2 The area^depth method.