Page 190 - Hydrocarbon
P. 190

Volumetric Estimation                                                 177


                                1                           1
                              1000  1200
                                  1400                                   0
                              OWC                                    10
                                                                     20
                                                                     20
                                                                     10
                                      1                    2
                                                                    0
                               Structure map           Net sand map (m)
                                                          (channel)


                       Thickness
                            (m)       4                    3
                            20
                                                              1
                                                                  0
                                                               10
                                                              20
                            10                              10 20
                                                              OWC
                             0
                                       Area (m 2)
                                 Net oil sand volume         Net oil sand (m)
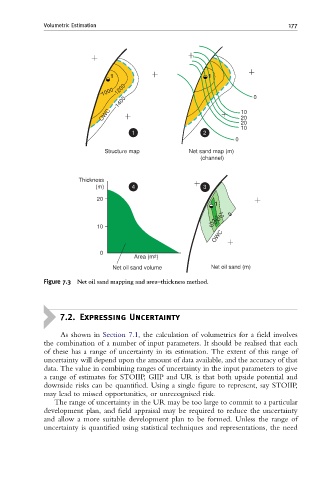
             Figure 7.3  Net oil sand mapping and area^thickness method.


                  7.2. Expressing Uncertainty

                  As shown in Section 7.1, the calculation of volumetrics for a field involves
             the combination of a number of input parameters. It should be realised that each
             of these has a range of uncertainty in its estimation. The extent of this range of
             uncertainty will depend upon the amount of data available, and the accuracy of that
             data. The value in combining ranges of uncertainty in the input parameters to give
             a range of estimates for STOIIP, GIIP and UR is that both upside potential and
             downside risks can be quantified. Using a single figure to represent, say STOIIP,
             may lead to missed opportunities, or unrecognised risk.
                The range of uncertainty in the UR may be too large to commit to a particular
             development plan, and field appraisal may be required to reduce the uncertainty
             and allow a more suitable development plan to be formed. Unless the range of
             uncertainty is quantified using statistical techniques and representations, the need
   185   186   187   188   189   190   191   192   193   194   195