
Page 194 - Hydrocarbon
P. 194
Volumetric Estimation 181
100
Cumulative Probability (%) 50 3 2 1
0 4
0 100 200 300 400
STOIIP (MMstb)
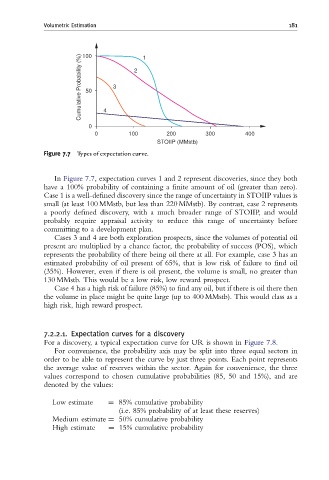
Figure 7.7 Types of expectation curve.
In Figure 7.7, expectation curves 1 and 2 represent discoveries, since they both
have a 100% probability of containing a finite amount of oil (greater than zero).
Case 1 is a well-defined discovery since the range of uncertainty in STOIIP values is
small (at least 100 MMstb, but less than 220 MMstb). By contrast, case 2 represents
a poorly defined discovery, with a much broader range of STOIIP, and would
probably require appraisal activity to reduce this range of uncertainty before
committing to a development plan.
Cases 3 and 4 are both exploration prospects, since the volumes of potential oil
present are multiplied by a chance factor, the probability of success (POS), which
represents the probability of there being oil there at all. For example, case 3 has an
estimated probability of oil present of 65%, that is low risk of failure to find oil
(35%). However, even if there is oil present, the volume is small, no greater than
130 MMstb. This would be a low risk, low reward prospect.
Case 4 has a high risk of failure (85%) to find any oil, but if there is oil there then
the volume in place might be quite large (up to 400 MMstb). This would class as a
high risk, high reward prospect.
7.2.2.1. Expectation curves for a discovery
For a discovery, a typical expectation curve for UR is shown in Figure 7.8.
For convenience, the probability axis may be split into three equal sectors in
order to be able to represent the curve by just three points. Each point represents
the average value of reserves within the sector. Again for convenience, the three
values correspond to chosen cumulative probabilities (85, 50 and 15%), and are
denoted by the values:
Low estimate ¼ 85% cumulative probability
(i.e. 85% probability of at least these reserves)
Medium estimate ¼ 50% cumulative probability
High estimate ¼ 15% cumulative probability