
Page 193 - Hydrocarbon
P. 193
180 Expressing Uncertainty
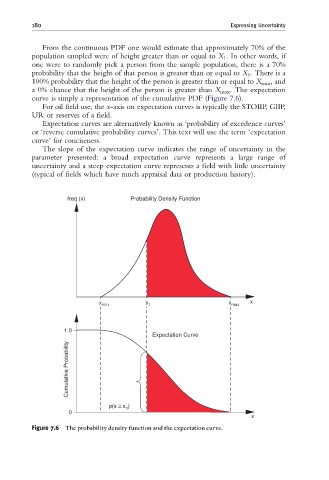
From the continuous PDF one would estimate that approximately 70% of the
population sampled were of height greater than or equal to X 1 . In other words, if
one were to randomly pick a person from the sample population, there is a 70%
probability that the height of that person is greater than or equal to X 1 . There is a
100% probability that the height of the person is greater than or equal to X min , and
a 0% chance that the height of the person is greater than X max . The expectation
curve is simply a representation of the cumulative PDF (Figure 7.6).
For oil field use, the x-axis on expectation curves is typically the STOIIP, GIIP,
UR or reserves of a field.
Expectation curves are alternatively known as ‘probability of excedence curves’
or ‘reverse cumulative probability curves’. This text will use the term ‘expectation
curve’ for conciseness.
The slope of the expectation curve indicates the range of uncertainty in the
parameter presented: a broad expectation curve represents a large range of
uncertainty and a steep expectation curve represents a field with little uncertainty
(typical of fields which have much appraisal data or production history).
freq (x) Probability Density Function
x min x 1 x max x
1.0
Expectation Curve
Cumulative Probability
1
0
x
Figure 7.6 The probability density function and the expectation curve.