
Page 145 - Hydrocarbon Exploration and Production Second Edition
P. 145
132 Reservoir Fluids
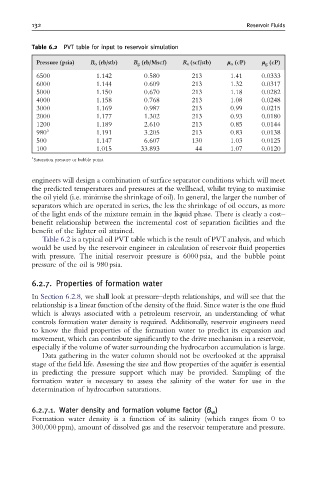
Table 6.2 PVT table for input to reservoir simulation
Pressure (psia) B o (rb/stb) B g (rb/Mscf) R s (scf/stb) l o (cP) l g (cP)
6500 1.142 0.580 213 1.41 0.0333
6000 1.144 0.609 213 1.32 0.0317
5000 1.150 0.670 213 1.18 0.0282
4000 1.158 0.768 213 1.08 0.0248
3000 1.169 0.987 213 0.99 0.0215
2000 1.177 1.302 213 0.93 0.0180
1200 1.189 2.610 213 0.85 0.0144
980 a 1.191 3.205 213 0.83 0.0138
500 1.147 6.607 130 1.03 0.0125
100 1.015 33.893 44 1.07 0.0120
a
Saturation pressure or bubble point.
engineers will design a combination of surface separator conditions which will meet
the predicted temperatures and pressures at the wellhead, whilst trying to maximise
the oil yield (i.e. minimise the shrinkage of oil). In general, the larger the number of
separators which are operated in series, the less the shrinkage of oil occurs, as more
of the light ends of the mixture remain in the liquid phase. There is clearly a cost–
benefit relationship between the incremental cost of separation facilities and the
benefit of the lighter oil attained.
Table 6.2 is a typical oil PVT table which is the result of PVTanalysis, and which
would be used by the reservoir engineer in calculation of reservoir fluid properties
with pressure. The initial reservoir pressure is 6000 psia, and the bubble point
pressure of the oil is 980 psia.
6.2.7. Properties of formation water
In Section 6.2.8, we shall look at pressure–depth relationships, and will see that the
relationship is a linear function of the density of the fluid. Since water is the one fluid
which is always associated with a petroleum reservoir, an understanding of what
controls formation water density is required. Additionally, reservoir engineers need
to know the fluid properties of the formation water to predict its expansion and
movement, which can contribute significantly to the drive mechanism in a reservoir,
especially if the volume of water surrounding the hydrocarbon accumulation is large.
Data gathering in the water column should not be overlooked at the appraisal
stage of the field life. Assessing the size and flow properties of the aquifer is essential
in predicting the pressure support which may be provided. Sampling of the
formation water is necessary to assess the salinity of the water for use in the
determination of hydrocarbon saturations.
6.2.7.1. Water density and formation volume factor (B w )
Formation water density is a function of its salinity (which ranges from 0 to
300,000 ppm), amount of dissolved gas and the reservoir temperature and pressure.