
Page 156 - Hydrogeology Principles and Practice
P. 156
HYDC04 12/5/05 5:36 PM Page 139
Environmental isotope hydrogeology 139
Table 4.3 Isotope and noble gas recharge temperatures for Chalk groundwaters in the London Basin along a N–S transect from the outcrop
on the North Downs to the confined centre of the Basin in the City of London. After Elliot et al. (1999).
2
13
18
Sample location Distance N along d H* d O* d C† 14 C (pmc) RT (°C) ±1 s.e.
transect (km)
1. Paynes u 0 −51 −7.4 −13.6 66.2 12.5 0.7
2. Philips 2 u 1.7 −48 −7.2 −13.4 11.4 0.9
3. BXL Plastics c 3.7 −3.6 4.3 9.0 0.5
4. Modeluxe c 6.3 −50 −7.4 −3.8 4.5 9.2 0.8
5. Sunlight c 10.9 −49 −8.7 14.6 10.2 0.6
6. Unigate c 13.4 −47 −7.2 −12.8 12.6 10.9 1.0
7. Harrods c 15.1 −51 −7.4 −4.8 17.1 9.5 0.8
8. Buchanan House c 16.3 −52 −7.3 −3.5 8.7 0.7
11. Unilever c 16.3 −53 −7.6 −2.5 1.0 6.8 0.6
10. Sainsburys c 16.3 −51 −7.4 −1.7 7.1 0.5
9. Dorset House c 17.4 −53 −7.8 −2.4 0.8 7.1 0.5
13. Kentish Town c 20.0 −53 −7.8 −2.6 0.8 5.4 0.6
12. Hornsey Road c 21.1 −54 −7.7 −2.6 1.4 5.8 0.5
pmc, % modern carbon; u, unconfined; c, confined; RT, noble gas recharge temperature; 1 s.e., 1 standard error.
* ±1‰ and ±0.1‰ relative to V SMOW .
† ±0.1‰ relative to PDB.
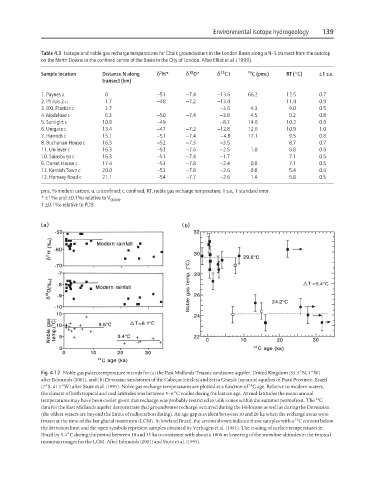
Fig. 4.12 Noble gas palaeotemperature records for (a) the East Midlands Triassic sandstone aquifer, United Kingdom (53.5°N, 1°W)
after Edmunds (2001), and (b) Devonian sandstones of the Cabeças (circles) and Serra Grande (squares) aquifers of Piaui Province, Brazil
14
(7°S, 41.5°W) after Stute et al. (1995). Noble gas recharge temperatures are plotted as a function of C age. Relative to modern waters,
the climate of both tropical and mid-latitudes was between 5–6°C cooler during the last ice age. At mid-latitudes the mean annual
14
temperatures may have been cooler given that recharge was probably restricted to talik zones within the summer permafrost. The C
data for the East Midlands aquifer demonstrate that groundwater recharge occurred during the Holocene as well as during the Devensian
(the oldest waters are beyond the limits of radiocarbon dating). An age gap is evident between 10 and 20 ka when the recharge areas were
14
frozen at the time of the last glacial maximum (LGM). In lowland Brazil, the arrows shown indicate those samples with a C content below
the detection limit and the open symbols represent samples obtained by Verhagen et al. (1991). The cooling of surface temperatures in
Brazil by 5.4°C during the period between 10 and 35 ka is consistent with about a 1000-m lowering of the snowline altitudes in the tropical
mountain ranges for the LGM. After Edmunds (2001) and Stute et al. (1995).