
Page 161 - Hydrogeology Principles and Practice
P. 161
HYDC05 12/5/05 5:34 PM Page 144
144 Chapter Five
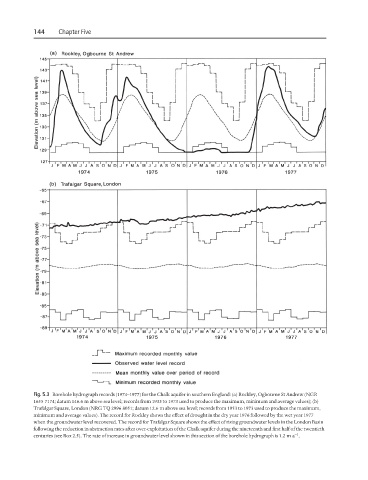
Fig. 5.3 Borehole hydrograph records (1974–1977) for the Chalk aquifer in southern England: (a) Rockley, Ogbourne St Andrew (NGR
1655 7174; datum 146.6 m above sea level; records from 1933 to 1973 used to produce the maximum, minimum and average values); (b)
Trafalgar Square, London (NRG TQ 2996 8051; datum 12.6 m above sea level; records from 1953 to 1973 used to produce the maximum,
minimum and average values). The record for Rockley shows the effect of drought in the dry year 1976 followed by the wet year 1977
when the groundwater level recovered. The record for Trafalgar Square shows the effect of rising groundwater levels in the London Basin
following the reduction in abstraction rates after over-exploitation of the Chalk aquifer during the nineteenth and first half of the twentieth
−1
centuries (see Box 2.5). The rate of increase in groundwater level shown in this section of the borehole hydrograph is 1.2 m a .