
Page 162 - Hydrogeology Principles and Practice
P. 162
HYDC05 12/5/05 5:34 PM Page 145
Groundwater investigation techniques 145
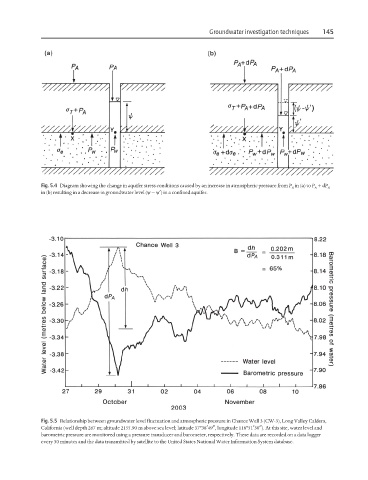
Fig. 5.4 Diagram showing the change in aquifer stress conditions caused by an increase in atmospheric pressure from P in (a) to P + dP
A A A
in (b) resulting in a decrease in groundwater level (ψ − ψ′) in a confined aquifer.
Fig. 5.5 Relationship between groundwater level fluctuation and atmospheric pressure in Chance Well 3 (CW-3), Long Valley Caldera,
California (well depth 267 m; altitude 2155.90 m above sea level; latitude 37º38′49″, longitude 118º51′30″). At this site, water level and
barometric pressure are monitored using a pressure transducer and barometer, respectively. These data are recorded on a data logger
every 30 minutes and the data transmitted by satellite to the United States National Water Information System database.