
Page 165 - Hydrogeology Principles and Practice
P. 165
HYDC05 12/5/05 5:35 PM Page 148
148 Chapter Five
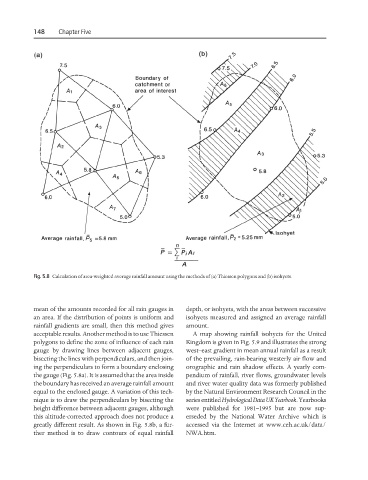
Fig. 5.8 Calculation of area-weighted average rainfall amount using the methods of (a) Thiessen polygons and (b) isohyets.
mean of the amounts recorded for all rain gauges in depth, or isohyets, with the areas between successive
an area. If the distribution of points is uniform and isohyets measured and assigned an average rainfall
rainfall gradients are small, then this method gives amount.
acceptable results. Another method is to use Thiessen A map showing rainfall isohyets for the United
polygons to define the zone of influence of each rain Kingdom is given in Fig. 5.9 and illustrates the strong
gauge by drawing lines between adjacent gauges, west–east gradient in mean annual rainfall as a result
bisecting the lines with perpendiculars, and then join- of the prevailing, rain-bearing westerly air flow and
ing the perpendiculars to form a boundary enclosing orographic and rain shadow effects. A yearly com-
the gauge (Fig. 5.8a). It is assumed that the area inside pendium of rainfall, river flows, groundwater levels
the boundary has received an average rainfall amount and river water quality data was formerly published
equal to the enclosed gauge. A variation of this tech- by the Natural Environment Research Council in the
nique is to draw the perpendiculars by bisecting the series entitled Hydrological Data UK Yearbook. Yearbooks
height difference between adjacent gauges, although were published for 1981–1995 but are now sup-
this altitude-corrected approach does not produce a erseded by the National Water Archive which is
greatly different result. As shown in Fig. 5.8b, a fur- accessed via the Internet at www.ceh.ac.uk/data/
ther method is to draw contours of equal rainfall NWA.htm.