
Page 163 - Hydrogeology Principles and Practice
P. 163
HYDC05 12/5/05 5:34 PM Page 146
146 Chapter Five
efficiency of a confined aquifer to aquifer and water
properties, including the storage coefficient. In uncon-
fined aquifers, atmospheric pressure changes are
transmitted directly to the water table, both in the
aquifer and in the well, such that the water level in
an observation well does not change. However, air
bubbles trapped in pores below the water table are
affected by pressure changes and can cause fluctu-
ations similar to but smaller than observed in confined
aquifers.
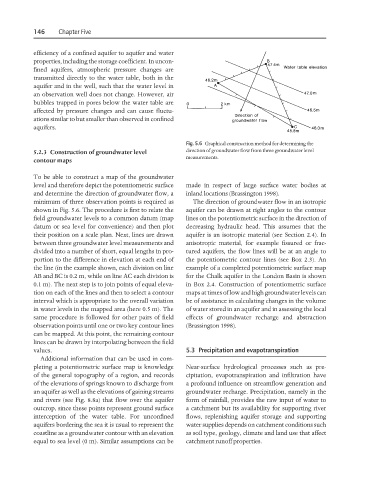
Fig. 5.6 Graphical construction method for determining the
5.2.3 Construction of groundwater level direction of groundwater flow from three groundwater level
measurements.
contour maps
To be able to construct a map of the groundwater
level and therefore depict the potentiometric surface made in respect of large surface water bodies at
and determine the direction of groundwater flow, a inland locations (Brassington 1998).
minimum of three observation points is required as The direction of groundwater flow in an isotropic
shown in Fig. 5.6. The procedure is first to relate the aquifer can be drawn at right angles to the contour
field groundwater levels to a common datum (map lines on the potentiometric surface in the direction of
datum or sea level for convenience) and then plot decreasing hydraulic head. This assumes that the
their position on a scale plan. Next, lines are drawn aquifer is an isotropic material (see Section 2.4). In
between three groundwater level measurements and anisotropic material, for example fissured or frac-
divided into a number of short, equal lengths in pro- tured aquifers, the flow lines will be at an angle to
portion to the difference in elevation at each end of the potentiometric contour lines (see Box 2.3). An
the line (in the example shown, each division on line example of a completed potentiometric surface map
AB and BC is 0.2 m, while on line AC each division is for the Chalk aquifer in the London Basin is shown
0.1 m). The next step is to join points of equal eleva- in Box 2.4. Construction of potentiometric surface
tion on each of the lines and then to select a contour maps at times of low and high groundwater levels can
interval which is appropriate to the overall variation be of assistance in calculating changes in the volume
in water levels in the mapped area (here 0.5 m). The of water stored in an aquifer and in assessing the local
same procedure is followed for other pairs of field effects of groundwater recharge and abstraction
observation points until one or two key contour lines (Brassington 1998).
can be mapped. At this point, the remaining contour
lines can be drawn by interpolating between the field
values. 5.3 Precipitation and evapotranspiration
Additional information that can be used in com-
pleting a potentiometric surface map is knowledge Near-surface hydrological processes such as pre-
of the general topography of a region, and records cipitation, evapotranspiration and infiltration have
of the elevations of springs known to discharge from a profound influence on streamflow generation and
an aquifer as well as the elevations of gaining streams groundwater recharge. Precipitation, namely in the
and rivers (see Fig. 8.8a) that flow over the aquifer form of rainfall, provides the raw input of water to
outcrop, since these points represent ground surface a catchment but its availability for supporting river
interception of the water table. For unconfined flows, replenishing aquifer storage and supporting
aquifers bordering the sea it is usual to represent the water supplies depends on catchment conditions such
coastline as a groundwater contour with an elevation as soil type, geology, climate and land use that affect
equal to sea level (0 m). Similar assumptions can be catchment runoff properties.