
Page 159 - Hydrogeology Principles and Practice
P. 159
HYDC05 12/5/05 5:34 PM Page 142
142 Chapter Five
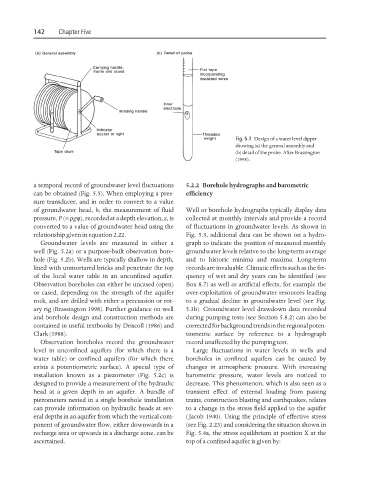
Fig. 5.1 Design of a water level dipper
showing (a) the general assembly and
(b) detail of the probe. After Brassington
(1998).
a temporal record of groundwater level fluctuations 5.2.2 Borehole hydrographs and barometric
can be obtained (Fig. 5.5). When employing a pres- efficiency
sure transducer, and in order to convert to a value
of groundwater head, h, the measurement of fluid Well or borehole hydrographs typically display data
pressure, P (= ρgψ), recorded at a depth elevation, z, is collected at monthly intervals and provide a record
converted to a value of groundwater head using the of fluctuations in groundwater levels. As shown in
relationship given in equation 2.22. Fig. 5.3, additional data can be shown on a hydro-
Groundwater levels are measured in either a graph to indicate the position of measured monthly
well (Fig. 5.2a) or a purpose-built observation bore- groundwater levels relative to the long-term average
hole (Fig. 5.2b). Wells are typically shallow in depth, and to historic minima and maxima. Long-term
lined with unmortared bricks and penetrate the top records are invaluable. Climatic effects such as the fre-
of the local water table in an unconfined aquifer. quency of wet and dry years can be identified (see
Observation boreholes can either be uncased (open) Box 8.7) as well as artificial effects, for example the
or cased, depending on the strength of the aquifer over-exploitation of groundwater resources leading
rock, and are drilled with either a percussion or rot- to a gradual decline in groundwater level (see Fig.
ary rig (Brassington 1998). Further guidance on well 5.3b). Groundwater level drawdown data recorded
and borehole design and construction methods are during pumping tests (see Section 5.8.2) can also be
contained in useful textbooks by Driscoll (1986) and corrected for background trends in the regional poten-
Clark (1988). tiometric surface by reference to a hydrograph
Observation boreholes record the groundwater record unaffected by the pumping test.
level in unconfined aquifers (for which there is a Large fluctuations in water levels in wells and
water table) or confined aquifers (for which there boreholes in confined aquifers can be caused by
exists a potentiometric surface). A special type of changes in atmospheric pressure. With increasing
installation known as a piezometer (Fig. 5.2c) is barometric pressure, water levels are noticed to
designed to provide a measurement of the hydraulic decrease. This phenomenon, which is also seen as a
head at a given depth in an aquifer. A bundle of transient effect of external loading from passing
piezometers nested in a single borehole installation trains, construction blasting and earthquakes, relates
can provide information on hydraulic heads at sev- to a change in the stress field applied to the aquifer
eral depths in an aquifer from which the vertical com- ( Jacob 1940). Using the principle of effective stress
ponent of groundwater flow, either downwards in a (see Fig. 2.23) and considering the situation shown in
recharge area or upwards in a discharge zone, can be Fig. 5.4a, the stress equilibrium at position X at the
ascertained. top of a confined aquifer is given by: