
Page 172 - Hydrogeology Principles and Practice
P. 172
HYDC05 12/5/05 5:35 PM Page 155
Groundwater investigation techniques 155
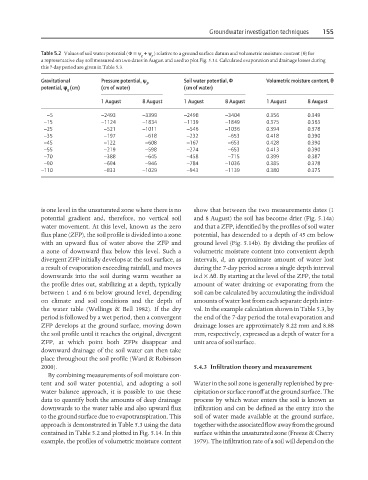
Table 5.2 Values of soil water potential (Φ = ψ + ψ ) relative to a ground surface datum and volumetric moisture content (θ) for
g p
a representative clay soil measured on two dates in August and used to plot Fig. 5.14. Calculated evaporation and drainage losses during
this 7-day period are given in Table 5.3.
Gravitational Pressure potential, y p Soil water potential, F Volumetric moisture content, q
potential, y (cm) (cm of water) (cm of water)
g
1 August 8 August 1 August 8 August 1 August 8 August
−5 −2493 −3399 −2498 −3404 0.356 0.349
−15 −1124 −1834 −1139 −1849 0.375 0.363
−25 −521 −1011 −546 −1036 0.394 0.378
−35 −197 −618 −232 −653 0.418 0.390
−45 −122 −608 −167 −653 0.428 0.390
−55 −219 −598 −274 −653 0.413 0.390
−70 −388 −645 −458 −715 0.399 0.387
−90 −694 −946 −784 −1036 0.385 0.378
−110 −833 −1029 −943 −1139 0.380 0.375
is one level in the unsaturated zone where there is no show that between the two measurements dates (1
potential gradient and, therefore, no vertical soil and 8 August) the soil has become drier (Fig. 5.14a)
water movement. At this level, known as the zero and that a ZFP, identified by the profiles of soil water
flux plane (ZFP), the soil profile is divided into a zone potential, has descended to a depth of 45 cm below
with an upward flux of water above the ZFP and ground level (Fig. 5.14b). By dividing the profiles of
a zone of downward flux below this level. Such a volumetric moisture content into convenient depth
divergent ZFP initially develops at the soil surface, as intervals, d, an approximate amount of water lost
a result of evaporation exceeding rainfall, and moves during the 7-day period across a single depth interval
downwards into the soil during warm weather as is d × ∆θ. By starting at the level of the ZFP, the total
the profile dries out, stabilizing at a depth, typically amount of water draining or evaporating from the
between 1 and 6 m below ground level, depending soil can be calculated by accumulating the individual
on climate and soil conditions and the depth of amounts of water lost from each separate depth inter-
the water table (Wellings & Bell 1982). If the dry val. In the example calculation shown in Table 5.3, by
period is followed by a wet period, then a convergent the end of the 7-day period the total evaporation and
ZFP develops at the ground surface, moving down drainage losses are approximately 8.22 mm and 8.88
the soil profile until it reaches the original, divergent mm, respectively, expressed as a depth of water for a
ZFP, at which point both ZFPs disappear and unit area of soil surface.
downward drainage of the soil water can then take
place throughout the soil profile (Ward & Robinson
2000). 5.4.3 Infiltration theory and measurement
By combining measurements of soil moisture con-
tent and soil water potential, and adopting a soil Water in the soil zone is generally replenished by pre-
water balance approach, it is possible to use these cipitation or surface runoff at the ground surface. The
data to quantify both the amounts of deep drainage process by which water enters the soil is known as
downwards to the water table and also upward flux infiltration and can be defined as the entry into the
to the ground surface due to evapotranspiration. This soil of water made available at the ground surface,
approach is demonstrated in Table 5.3 using the data together with the associated flow away from the ground
contained in Table 5.2 and plotted in Fig. 5.14. In this surface within the unsaturated zone (Freeze & Cherry
example, the profiles of volumetric moisture content 1979). The infiltration rate of a soil will depend on the