
Page 177 - Hydrogeology Principles and Practice
P. 177
HYDC05 12/5/05 5:35 PM Page 160
160 Chapter Five
Table 5.4 Monthly root constant (RC) values for the Penman–Grindley method. Values in millimetres. Based on Grindley (1969).
Month Crop type
1 2 3 4 5 6 7 8 9 10 11 12 13 14
Jan. and Feb. 25 25 25 25 25 25 25 25 25 25 56 76 13 203
Mar. 56 56 56 25 25 56 25 25 25 25 56 76 13 203
Apr. 76 76 76 76 56 56 56 25 25 25 56 76 13 203
May 97 97 97 56 56 56 56 56 25 25 56 76 13 203
Jun. and Jul. 140 140 140 76 76 25 56 56 56 25 56 76 13 203
Aug. 140 140 25 97 97 25 25 56 56 25 56 76 13 203
Sept. 140 25 25 97 25 25 25 25 56 25 56 76 13 203
Oct. 25 25 25 97 25 25 25 25 56 25 56 76 13 203
Nov. and Dec. 25 25 25 25 25 25 25 25 25 25 56 76 13 203
Notes: Valid for England and Wales (temperate, maritime climate). Crop types are: 1, cereals, Sept. harvest; 2, cereals, Aug. harvest; 3, cereals,
July harvest; 4, potatoes, Sept. harvest; 5, potatoes, May harvest; 6, vegetables, May harvest; 7, vegetables, July harvest; 8, vegetables, Aug.
harvest; 9, vegetables, Oct. harvest; 10, bare fallow; 11, temporary grass; 12, permanent grass; 13, rough grazing; 14, woodland; 15, riparian
(not shown) since RC effectively infinite.
SMD = 0 provides an estimate of groundwater recharge
for the period of interest (291 mm in the example
shown in Table 5.5).
According to the conventional soil water budget-
ing method, recharge cannot occur when a SMD
exists. A critique by Rushton and Ward (1979) showed
that recharge amount calculated using the Penman–
Grindley method often under-predicts the amount
calculated by other methods based on lysimeters,
tracers and hydrograph analysis. In particular, the
Penman–Grindley method appears to underestimate
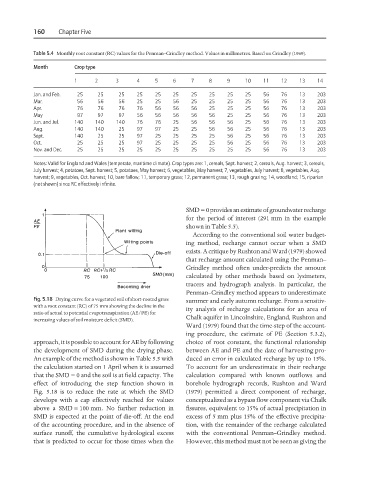
Fig. 5.18 Drying curve for a vegetated soil of short-rooted grass summer and early autumn recharge. From a sensitiv-
with a root constant (RC) of 75 mm showing the decline in the
ity analysis of recharge calculations for an area of
ratio of actual to potential evapotranspiration (AE/PE) for
Chalk aquifer in Lincolnshire, England, Rushton and
increasing values of soil moisture deficit (SMD).
Ward (1979) found that the time-step of the account-
ing procedure, the estimate of PE (Section 5.3.2),
approach, it is possible to account for AE by following choice of root constant, the functional relationship
the development of SMD during the drying phase. between AE and PE and the date of harvesting pro-
An example of the method is shown in Table 5.5 with duced an error in calculated recharge by up to 15%.
the calculation started on 1 April when it is assumed To account for an underestimate in their recharge
that the SMD = 0 and the soil is at field capacity. The calculation compared with known outflows and
effect of introducing the step function shown in borehole hydrograph records, Rushton and Ward
Fig. 5.18 is to reduce the rate at which the SMD (1979) permitted a direct component of recharge,
develops with a cap effectively reached for values conceptualized as a bypass flow component via Chalk
above a SMD = 100 mm. No further reduction in fissures, equivalent to 15% of actual precipitation in
SMD is expected at the point of die-off. At the end excess of 5 mm plus 15% of the effective precipita-
of the accounting procedure, and in the absence of tion, with the remainder of the recharge calculated
surface runoff, the cumulative hydrological excess with the conventional Penman–Grindley method.
that is predicted to occur for those times when the However, this method must not be seen as giving the