
Page 185 - Illustrated Pocket Dictionary of Chromatography
P. 185
STANDARD ADDITIONS 187
standard deviation, s A measure of the uncertainty present in a
set of related results. To calculate s use:
2
- )
- ) (n 1
x
s=÷ ( S x i
where x i is the individual ith datum, x is the mean, and n is the
total number of data points in the set. As an example, for the set
of data 6.1, 6.4, 6.2, 6.2, 6.1, x = 6.2 and the deviations from the mean
for each point are -0.1, +0.2, 0, 0, and -0.1, respectively. Therefore,
2
2
2
2
2
s=÷[(-0.1) + (0.2) + 0 + 0 + (-0.1) ]/(5 - 1) =÷0.06/4 = 0.12.
standard A material of known identity and purity that is used to
establish the establish the concentration of the same compound in
a sample. Standards can be primary (i.e., certified by an organization
recognized as being capable of producing certified primary standards),
secondary (or traceable, meaning that they are assayed against a certi-
fied primary standard material), or “off the shelf” such that the manu-
facturer’s certificate of analysis is used as substantiation as to the
material’s purity. Primary standards give the highest degree of certainty
and are frequently the standard employed in the analysis of regulated
materials.
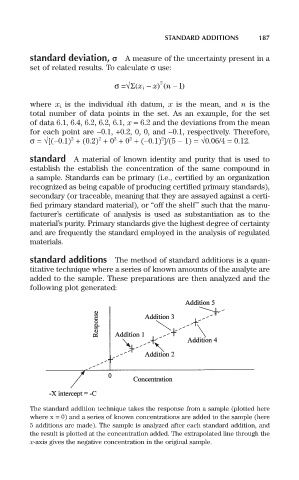
standard additions The method of standard additions is a quan-
titative technique where a series of known amounts of the analyte are
added to the sample. These preparations are then analyzed and the
following plot generated:
The standard addition technique takes the response from a sample (plotted here
where x = 0) and a series of known concentrations are added to the sample (here
5 additions are made). The sample is analyzed after each standard addition, and
the result is plotted at the concentration added. The extrapolated line through the
x-axis gives the negative concentration in the original sample.