
Page 124 - Improving Machinery Reliability
P. 124
96 Improving Machinery Reliability
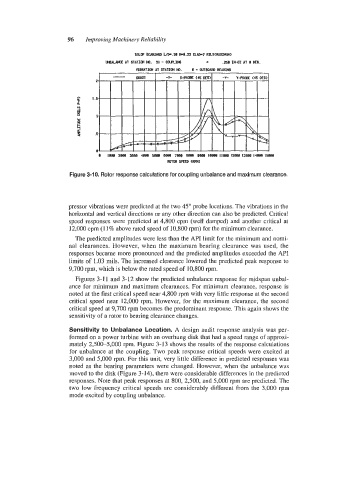
Figure 3-10. Rotor response calculations for coupling unbalance and maximum clearance.
pressor vibrations were predicted at the two 45" probe locations. The vibrations in the
horizontal and vertical directions or any other direction can also be predicted. Critical
speed responses were predicted at 4,800 cpm (well damped) and another critical at
12,000 cpm (1 1% above rated speed of 10,800 rpm) for the minimum clearance.
The predicted amplitudes were less than the API limit for the minimum and nomi-
nal clearances. However, when the maximum bearing clearance was used, the
responses became more pronounced and the predicted amplitudes exceeded the API
limits of 1.03 mils. The increased clearance lowered the predicted peak response to
9,700 rpm, which is below the rated speed of 10,800 rpm.
Figures 3-1 1 and 3-12 show the predicted unbalance response for midspan unbal-
ance for minimum and maximum clearances. For minimum clearance, response is
noted at the first critical speed near 4,800 rpm with very little response at the second
critical speed near 12,000 rpm. However, for the maximum clearance, the second
critical speed at 9,700 rpm becomes the predominant response. This again shows the
sensitivity of a rotor to bearing clearance changes.
Sensitivity to Unbalance Location. A design audit response analysis was per-
formed on a power turbine with an overhung disk that had a speed range of approxi-
mately 2,500-5,000 rpm. Figure 3-1 3 shows the results of the response calculations
for unbalance at the coupling. Two peak response critical speeds were excited at
3,000 and 5,000 rpm. For this unit, very little difference in predicted responses was
noted as the bearing parameters were changed. However, when the unbalance was
moved to the disk (Figure 3- 14), there were considerable differences in the predicted
responses. Note that peak responses at 800, 2,500, and 5,000 rpm are predicted. The
two low frequency critical speeds are considerably different from the 3,000 rpm
mode excited by coupling unbalance.