
Page 128 - Improving Machinery Reliability
P. 128
100 Improving Machinery Reliability
rijiiiii
STAGE NO. I
a 0 I
-€-
OUTBOARD IYPELL INBOARD
BEARING I I BEARING
twEkn I IuPLEn I
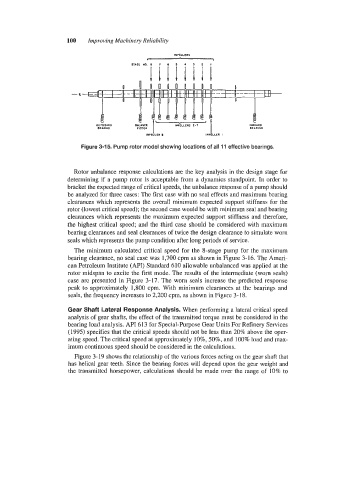
Figure 3-15. Pump rotor model showing locations of all 11 effective bearings.
Rotor unbalance response calculations are the key analysis in the design stage for
determining if a pump rotor is acceptable from a dynamics standpoint. In order to
bracket the expected range of critical speeds, the unbalance response of a pump should
be analyzed for three cases: The first case with no seal effects and maximum bearing
clearances which represents the overall minimum expected support stiffness for the
rotor (lowest critical speed); the second case would be with minimum seal and bearing
clearances which represents the maximum expected support stiffness and therefore,
the highest critical speed; and the third case should be considered with maximum
bearing clearances and seal clearances of twice the design clearance to simulate worn
seals which represents the pump condition after long periods of service.
The minimum calculated critical speed for the 8-stage pump for the maximum
bearing clearance, no seal case was 1,700 cpm as shown in Figure 3-16. The Ameri-
can Petroleum Institute (API) Standard 610 allowable unbalanced was applied at the
rotor midspan to excite the first mode. The results of the intermediate (worn seals)
case are presented in Figure 3-17. The worn seals increase the predicted response
peak to approximately 1,800 cpm. With minimum clearances at the bearings and
seals, the frequency increases to 2,200 cpm, as shown in Figure 3- 18.
Gear Shaft Lateral Response Analysis. When performing a lateral critical speed
analysis of gear shafts, the effect of the transmitted torque must be considered in the
bearing load analysis. API 61 3 for Special-Purpose Gear Units For Refinery Services
(1995) specifies that the critical speeds should not be less than 20% above the oper-
ating speed. The critical speed at approximately IO%, 50%, and 100% load and max-
imum continuous speed should be considered in the calculations.
Figure 3-19 shows the relationship of the various forces acting on the gear shaft that
has helical gear teeth. Since the bearing forces will depend upon the gear weight and
the transmitted horsepower, calculations should be made over the range of 10% to