
Page 176 - Improving Machinery Reliability
P. 176
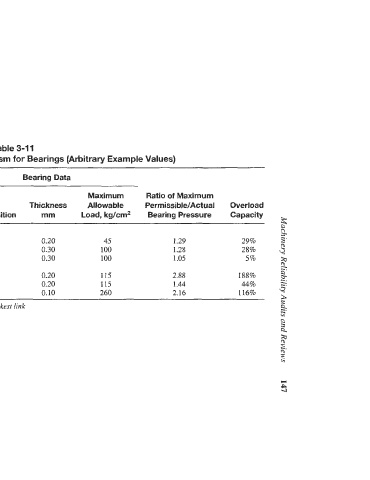
Table 3-1 1
 Determination of Design Conservatism for Bearings (Arbitrary Example Values)
     Bearing Data
                Maximum    Ratio of Maximum
 Projected   Actual Bearing   Thickness   Allowable   Permissible/Actual   Overload
 Area cm2   Pressure kg/cm2   Composition   mm   Load, kg/cm2   Bearing Pressure   Capacity
                                                  3
 Vendor X                                         3
                                                  5
 Main Bearing   1,900   35   tI   0.20   45   1.29   29%   m
 Crank Bearing   1,700   78   I1   0.30   100   1.28   28%   9
 Crosshead Bearing   1,400   95   I1   0.30   100   1.05   5%
 Vendor Y                                         !?
                                                  fi'
                                                  z
 Main Bearing   1,800   40   I1   0.20   115   2.88   188%   -
 Crank Bearing   1,800   80   I1   0.20   115   1.44   44%
 Crosshead Bearing   1,200   120   I   0.10   260   2.16   116%
                                                  r:
 Resulr: Overload Capacity Vendor X = 5%. Crosshead bearings are the weakest link   a.  -_
 Overload Capacity Vendor Y = 44%. Crank bearings are the weakesr link   2
                                                  a
                                                  3
                                                  a.