
Page 178 - Improving Machinery Reliability
P. 178
Machinery Reliability Audits and Reviews 149
stantially greater than claimed by the pump vendor. This is in part due to the fact that
Hydraulic Institute Standards permit pump manufactures to plot as NPSH, values
those test points where a 3% drop in discharge pressure was noted.35 Unfortunately,
cavitation may already be quite severe at these points. It has also been suspected that
vendors have occasionally extrapolated a few test points into a smooth curve that did
not represent the real situation.
Then again, user demand for high efficiency, lower cost, and low NrPSHR pumps
drove suction-specific speeds into the range above 12,000, where certain deviations
from BEP flow could cause internal recirculation phenomena which render pump
operation hydraulically unstable. Turbulent flow causes impeller erosion and signifi-
cant fluctuations in mechanical seal action, bearing loading, and shaft deflection. It
is worthwhile to note that for many pumps the manufacturer’s published minimum
acceptable flow values were based on flow necessary to prevent excessive heat
buildup. These values may not even approach the minimum permissible flow for
erosion avoidance in high Nsss pumps; they have been found off by very substantial
margins on numerous occasions.
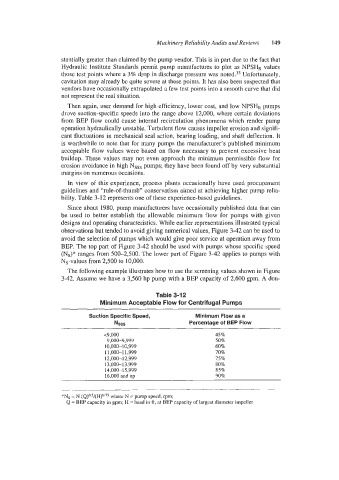
In view of this experience, process plants occasionally have used procurement
guidelines and “rule-of-thumb” conservatism aimed at achieving higher pump relia-
bility. Table 3- 12 represents one of these experience-based guidelines.
Since about 1980, pump manufacturers have occasionally published data that can
be used to better establish the allowable minimum flow for pumps with given
designs and operating characteristics, While earlier representations illustrated typical
observations but tended to avoid giving numerical values, Figure 3-42 can be used to
avoid the selection of pumps which would give poor service at operation away from
BEP. The top part of Figure 3-42 should be used with pumps whose specific speed
(Ms)* ranges ffrom 500-2,500. The lower part of Figure 3-42 applies to pumps with
Ns-values from 2,500 to 10,000.
The following example illustrates how to use the screening values shown in Figure
3-42. Assume we have a 3,560 hp pump with a BEP capacity of 2,600 gpm. A dou-
Table 3-12
Minimum Acceptable Flow for Centrifugal Pumps
Suction Specific Speed, Minimum Flow as a
Nsss Percentage of BEP Flow
<9,000 45%
9,000-9,999 50%
10,000-1 0,999 60%
1 1,000-1 1,999 70%
12,000-12,999 75%
1 3,000- 1 3,999 80%
14,000-15,999 85%
16,000 and up 90%
*Ns = N (Q)0.5/(H)075 where N = pump speed, rpm;
Q = BEP capacity in gpm; H =head in ft, at BEP capacity of largest diameter impeller