
Page 343 - Improving Machinery Reliability
P. 343
Life Cycle Cost Studies 309
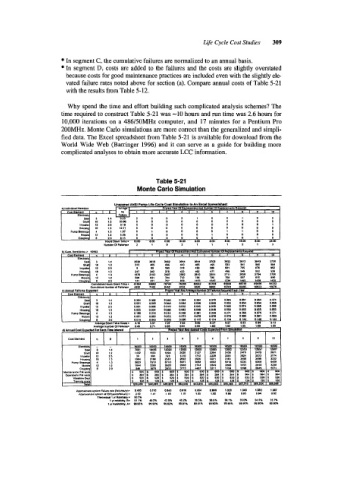
In segment C, the cumulative failures are normalized to an annual basis.
In segment ID, costs are added to the failures and the costs are slightly overstated
because costs for good maintenance practices are included even with the slightly ele-
vated failure rates noted above for section (a). Compare annual costs of Table 5-21
with the results from Table 5-12.
Why spend the time and effort building such complicated analysis schemes? The
time required to construct Table 5-21 was -10 hours and run time was 2.6 hours for
10,000 iterations on a 486/50MHz computer, and 17 minutes for a Pentium Pro
200MHz. Monte Carlo simulations are more correct than the generalized and simpli-
fied data. The Excel spreadsheet from Table 5-21 is available for download from the
World Wide Web (Barringer 1996) and it can serve as a guide for building more
complicated analyses to obtain more accurate LCC information.
Table 5-21
Monte Carlo Simulation