
Page 342 - Improving Machinery Reliability
P. 342
308 Improving Machinery Reliability
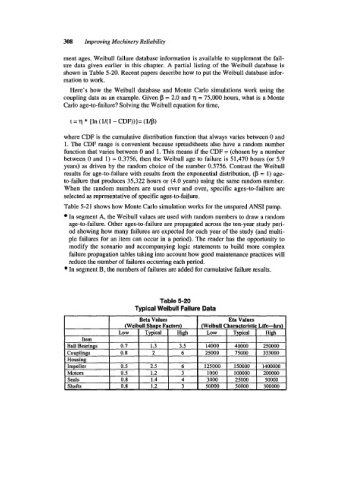
ment ages. Weibull failure database information is available to supplement the fail-
ure data given earlier in this chapter. A partial listing of the Weibull database is
shown in Table 5-20. Recent papers describe how to put the Weibull database infor-
mation to work.
Here’s how the Weibull database and Monte Carlo simulations work using the
coupling data as an example. Given p = 2.0 and q = 75,000 hours, what is a Monte
Carlo age-to-failure? Solving the Weibull equation for time,
t = q * {In (1/( 1 - CDF))}= (Up)
where CDF is the cumulative distribution function that always varies between 0 and
1. The CDF range is convenient because spreadsheets also have a random number
function that varies between 0 and 1. This means if the CDF = (chosen by a number
between 0 and 1) = 0.3756, then the Weibull age to failure is 51,470 hours (or 5.9
years) as driven by the random choice of the number 0.3756. Contrast the Weibull
results for age-to-failure with results from the exponential distribution, (0 = 1) age-
to-failure that produces 35,322 hours or (4.0 years) using the same random number.
When the random numbers are used over and over, specific ages-to-failure are
selected as representative of specific ages-to-failure.
Table 5-21 shows how Monte Carlo simulation works for the unspared ANSI pump.
In segment A, the Weibull values are used with random numbers to draw a random
age-to-failure. Other ages-to-failure are propagated across the ten-year study peri-
od showing how many failures are expected for each year of the study (and multi-
ple failures for an item can occur in a period). The reader has the opportunity to
modify the scenario and accompanying logic statements to build more complex
failure propagation tables taking into account how good maintenance practices will
reduce the number of failures occurring each period.
In segment B, the numbers of failures are added for cumulative failure results.
Table 5-20
Typical Weibull Failure Data