
Page 337 - Improving Machinery Reliability
P. 337
Lost Looistics Margin 31
303
Life Cycle Cost Studies
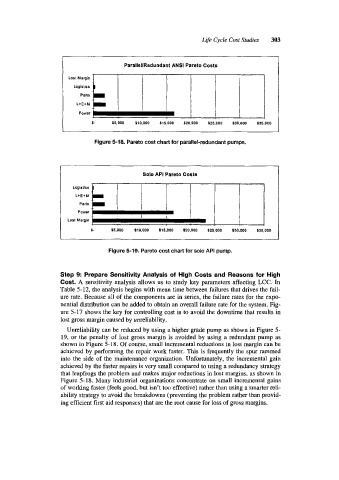
ParalleURedundant ANSI Pareto Costs
Pads
L+E+M I
Power
I- $5,000 $10,000 $15,000 $20,000 $25,000 $30.000 535.000
Figure 5-18. Pareto cost chart for parallel-redundant pumps.
$ 1
LoglsIICs Solo API Pareto Costs
L+E+M
Parts
Power
Lost Margin I
J- $5.000 $10,000 S15.000 $20.000 $25,000 $30,000 535,000
Figure 5-19. Pareto cost chart for solo API pump.
Step 9: Prepare Sensitivity Analysis of High Costs and Reasons for High
Cost. A sensitivity analysis allows us to study key parameters affecting LCC. In
Table 5-12, the analysis begins with mean time between failures that drives the fail-
ure rate. Because all of the components are in series, the failure rates for the expo-
nential distribution can be added to obtain an overall failure rate for the system. Fig-
ure 5-17 shows the key for controlling cost is to avoid the downtime that results in
lost gross margin caused by unreliability.
Unreliability can be reduced by using a higher grade pump as shown in Figure 5-
19, or the penalty of lost gross margin is avoided by using a redundant pump as
shown in Figure 5-18. Of course, small incremental reductions in lost margin can be
achieved by performing the repair work faster. This is frequently the spur rammed
into the side of the maintenance organization. Unfortunately, the incremental gain
achieved by the faster repairs is very small compared to using a redundancy strategy
that leapfrogs the problem and makes major reductions in lost margins, as shown in
Figure 5- 18. Many industrial organizations concentrate on small incremental gains
of working faster (feels good, but isn’t too effective) rather than using a smarter reli-
ability strategy to avoid the breakdowns (preventing the problem rather than provid-
ing efficient first aid responses) that are the root cause for loss of gross margins.