
Page 332 - Improving Machinery Reliability
P. 332
Life Cycle Cost Studies 299
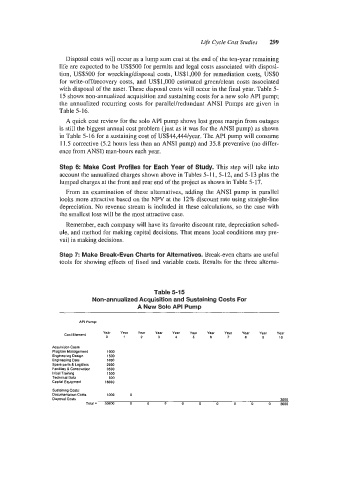
Disposal costs will occur as a lump sum cost at the end of the ten-year remaining
life are expected to be US$500 for permits and legal costs associated with disposi-
tion, US$500 for wrecking/disposal costs, US$l ,000 for remediation costs, US$O
for write-off/recovery costs, and US$l ,000 estimated greedclean costs associated
with disposal of the asset. These disposal costs will occur in the final year. Table 5-
15 shows non-annualized acquisition and sustaining costs for a new solo API pump;
the annualized recurring costs for parallekedundant ANSI Pumps are given in
Table 5-16.
A quick cost review for the solo API pump shows lost gross margin from outages
is still the biggest annual cost problem (just as it was for the ANSI pump) as shown
in Table 5-16 for a sustaining cost of US$44,444/year. The API pump will consume
11.5 corrective (5.2 hours less than an ANSI pump) and 35.8 preventive (no differ-
ence from ANSI) man-hours each year.
Step 6: Make Cost Profiles for Each Year of Study. This step will take into
account the annualized charges shown above in Tables 5-1 1, 5-12, and 5-13 plus the
Bumped charges at the front and rear end of the project as shown in Table 5-17.
From an examination of these alternatives, adding the ANSI pump in parallel
looks more attractive based on the NPV at the 12% discount rate using straight-line
depreciation. No revenue stream is included in these calculations, so the case with
the smallest loss will be the most attractive case.
Remember, each company will have its favorite discount rate, depreciation sched-
ule, and method for making capital decisions. That means local conditions may pre-
vail in making decisions.
Step 7: Make Break-Even Charts for Alternatives. Break-even charts are useful
tools for showing effects of fixed and variable costs. Results for the three alterna-
Table 5-15
Non-annualized Acquisition and Sustaining Costs For
A New Solo API Pump
API Pump:
Year Year Year Year Year Year Year Year Year Year Year
Cost Element
0 1 2 3 4 5 6 7 8 9 10
Acquisition Cosls
Program Managemenl 1000
Engineering Design 1500
Engineering Data 1000
Spare parts a Logistics 2900
Faeflibes a Constructmn 3500
lnilial Tiaining 1500
TechnKal Dala 500
Capital Equipmenl 18000
Suslaining Cosls
Dowmentation Cosls 1000 0
Disposal Cosls 3000
Tolot= 30800 0 0 0 0 0 0 0 0 0 3000