
Page 335 - Improving Machinery Reliability
P. 335
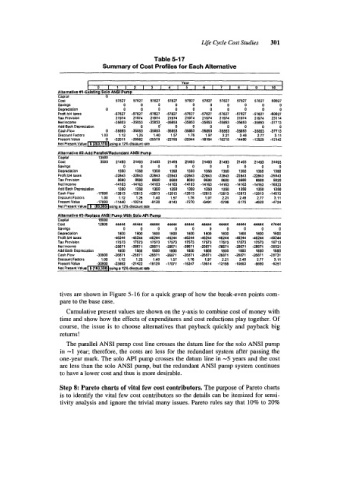
Life Cycle Cost Studies   301

                                               Table 5-17
                                Summary of Cost Profiles for Each Alternative

                                                       Year
                              0  1  1  1  2  1  3  1  4  [  5  1  6  1  7  1  8  1  9  I   10
                  Alternative #l-Exlsting Solo ANSI Pump
                  capluai        0
                  cost             57827   57827   57827   57827   57827   57827   57827   57827   57827   60827
                  Sanngs              0    0    0    0    0    0    0     0    0    0
                  De pr eu a tr 0 n   0   0   0   0   0   0    0    0     0    0    0
                  Profit W4 laxes   -57827  -57827  -57827  W827  -57827  -57827  -57827  -57827  -57827  -60827
                  Tax Provision    21974   21974   21974   21974   21974   21974   21974   21974   21974   23114
                  Ne( Income       -35853  -35853  -35853  -35853  -35853  -35853  -35853  -35853  -35853  -37713
                  Add Back Depteuahon   0   0   0’   0    0    0    0     0    0    0
                  Cash Flow      0   -35853  -35853  -35853  -35853  -35853  -35853  -35853   -35853  -35853  -37713
                  Discount Factors   1W   112   125   140   157   176   197   221   248   277   311
                  Present Value   0  -32011  -28582  -25519  -22785  -20344  -18154  -16218  -14480  -12929  -12142
                  Met Present Value  I (zll3.175)~using 12% discount rale
                                    a
                  Alternallve #&Add  ParallellRedundanl ANSI Pump               -
                  Capital     13500
                  cost         3500   21493   21493   21493   21493   21493   21493   21493   21493   21493   24493
                  Savings             0    0    0    0    0    0    0    0     0    0
                  Depreclalron      1350   1350   1350   1350   1350   1350   1350   1350   1350   1350
                  Profi! W4 (axes   -22843  -22843  -22843  -22843  -22843  42843  -22843  -22843  -22843  -25843
                  Tax Provision     8680   8580   8680   8680   8680   8680   8680   8680   8680   9820
                  Net lmome        -14163  -14163  -14163  -14163  -14163  -14163  -14163  -14163  -14163  -16023
                  Add Back Deprecrauon   1350   1350   1350   1350   1350   1350   1350   1350   1350   1350
                  Cash Flow   -17000  -12813  -12813  -12813  -12813  -12813  -12813  -12813  -12813  -12813  -14673
                  Discount Faclors   100   112   125   140   1.57   1.76   1.97   2.21   2.48   2.77   3.11
                  Present Value   -17000  -11440  -10214   -9120   -8143   -7270   -6491   -5796   -5175   -4620   -4724
                  Net Present Value I I  (89.993)lusinp a 12% discounl rate
                  Allernative #3-Replace ANSI Pump With Solo API Pump
                  Capital     I8000
                  Cor1        12900   44444   44444   44444   44444   44444   44444   44444   44444   44444   47444
                  Savlngs             0    0    0    0    0    0    0    0     0    0
                  Depredation       iaoo   1800   1800   1800   1800   1800   1800   1800   1800   IBOO
                  Prolit b/4 laxer   -46244  -46244  46244  -46244  -46244  -46244  -46244  -46244  -46244  -49244
                  Tax Provision    17573   17573   17573   17573   17573   17573   17573   17573   17573   18713
                  Ne1 Income       -28671  -28671  -28671  -28671  -28671  -28671  -28671  -28671  -28671  -30531
                  Add Back Depreuation   1800   1800   I800   1800   1800   1800   18W   1800   1800   1800
                  Cash Flow   -30900  -26871  -26871  -26871  -26871  -26871  -26871  *26871  -26871  -26871  -28731
                  Discount Factors   1.00   1.12   1.25   1.40   1.57   1.76   1.97   2.21   2.48   2.77   3.11
                  Present Value   -30900  -23992  -21422  -19126  -17077  -15247  -13614  -12155  -10853   -9690   -9251
                                    a
                  Net PresenlValuel S (183,328)~using 12% discount rale
                   tives are shown in Figure 5-16 for a quick grasp of how the break-even points com-
                   pare to the base case.
                     Cumulative present values are shown on the y-axis to combine cost of money with
                   time and show how the effects of expenditures and cost reductions play together. Of
                   course,  the  issue  is  to choose alternatives  that  payback  quickly  and payback  big
                   returns!
                     The parallel ANSI pump cost line crosses the datum line for the solo ANSI pump
                   in -1  year; therefore, the costs are less for the redundant  system after passing the
                   one-year mark. The solo API pump crosses the datum line in -5  years and the cost
                   are less than the solo ANSI pump, but the redundant ANSI pump system continues
                   to have a lower cost and thus is more desirable.

                   Step 8: Pareto charts of vital few cost contributors. The purpose of Pareto charts
                   is to identify the vital few cost contributors so the details can be itemized for sensi-
                   tivity analysis and ignore the trivial many issues. Pareto rules say that  10% to 20%