
Page 336 - Improving Machinery Reliability
P. 336
302 Improving Machinery Reliability
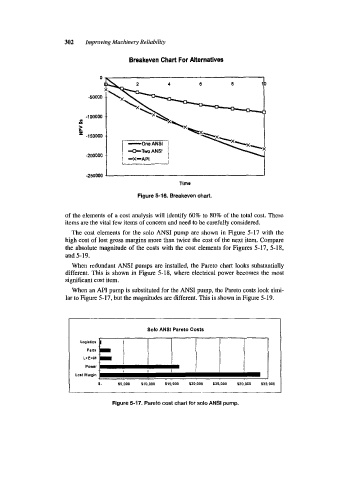
Breakeven Chart For Alternatives
-100000 --
L*
YL
2
-150000 --
-250000 e
Tlme
Figure 5-16. Breakeven chart.
of the elements of a cost analysis will identify 60% to 80% of the total cost. These
items are the vital few items of concern and need to be carefully considered.
The cost elements for the solo ANSI pump are shown in Figure 5-17 with the
high cost of lost gross margins more than twice the cost of the next item. Compare
the absolute magnitude of the costs with the cost elements for Figures 5-17, 5-18,
and 5-19.
When redundant ANSI pumps are installed, the Pareto chart looks substantially
different. This is shown in Figure 5-18, where electrical power becomes the most
significant cost item.
When an API pump is substituted for the ANSI pump, the Pareto costs look simi-
lar to Figure 5-17, but the magnitudes are different. This is shown in Figure 5-19.
Solo ANSI Pareto Costs
Loglsllcs
L+E+M
Power
Lost Margin
5- 55.000 $10.000 515,000 520.000 $25,000 530,OOO $35.000
Figure 5-17. Pareto cost chart for solo ANSI pump.