
Page 416 - Improving Machinery Reliability
P. 416
380 Improving Machinery Reliability
active part in turnaround planning. When the local plant schedules a turnaround, the
roles are reversed and the affiliate teams travel to the local plant site.
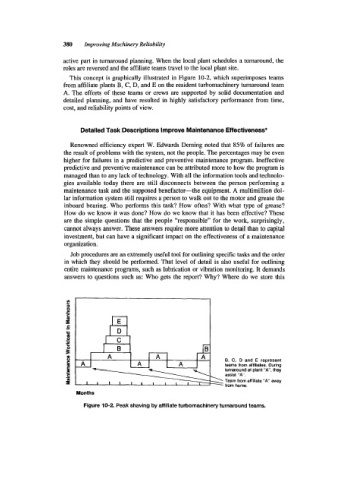
This concept is graphically illustrated in Figure 10-2, which superimposes teams
from affiliate plants B, C, D, and E on the resident turbomachinery turnaround team
A. The efforts of these teams or crews are supported by solid documentation and
detailed planning, and have resulted in highly satisfactory performance from time,
cost, and reliability points of view.
Detailed Task Descriptions Improve Maintenance Effectiveness*
Renowned efficiency expert W. Edwards Deming noted that 85% of failures are
the result of problems with the system, not the people. The percentages may be even
higher for failures in a predictive and preventive maintenance program. Ineffective
predictive and preventive maintenance can be attributed more to how the program is
managed than to any lack of technology. With all the information tools and technolo-
gies available today there are still disconnects between the person performing a
maintenance task and the supposed benefactor-the equipment. A multimillion dol-
lar information system still requires a person to walk out to the motor and grease the
inboard bearing. Who performs this task? How often? With what type of grease?
How do we know it was done? How do we know that it has been effective? These
are the simple questions that the people “responsible” for the work, surprisingly,
cannot always answer. These answers require more attention to detail than to capital
investment, but can have a significant impact on the effectiveness of a maintenance
organization.
Job procedures are an extremely useful tool for outlining specific tasks and the order
in which they should be performed. That level of detail is also useful for outlining
entire maintenance programs, such as lubrication or vibration monitoring. It demands
answers to questions such as: Who gets the report? Why? Where do we store this
8 E, C, D and E represent
c
m teams from alliliates. During
C a
turnaround at plant “A. they
4. e .- assist “A’.
g Team from affiliate ”A’ away
from home.
Months
Figure 10-2. Peak shaving by affiliate turbomachinery turnaround teams.