
Page 597 - Industrial Power Engineering and Applications Handbook
P. 597
17/562 Industrial Power Engineering and Applications Handbook
it such as a switching device to a cable, a cable to an 1 2 3
overhead line or a transformer and an induction motor
etc, then the frequency of oscillations will continue to
alter after every junction. At each junction the travelling
wave will encounter a wave reflection and add more
impedance in its circuit, as it will propagate ahead. After
every reflection, the circuit parameters will change as
will the frequency of uscillations. Thus, a number of
oscillatory frequencies may exist in the system at a time,
leading to a more complex phenomenon and making it
difficult to accurately determine the effective surge
frequency of the system and the r.r.r.v. By the use of
oscillograms such as that shown in Figure 17.5, it is
possible to determine such complex quantities.
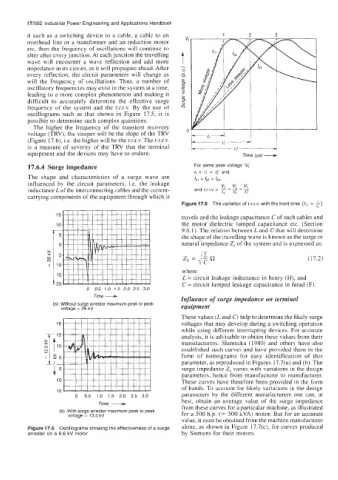
The higher the frequency of the transient recovery
voltage (TRV), the steeper will be the slope of the TRV
(Figure 17.6), Le. the higher will be the r.r.r.v. The r.r.r.v.
is a measure of severity of the TRV that the terminal
equipment and the devices may have to endure. Time Ips)
17.6.4 Surge impedance For same peak voltage 'V,'
tl < ti < f; and
The shape and characteristics of a surge wave are fSl > f*z '
fs3
influenced by the circuit parameters, Le. the leakage VI vt vt
inductance L of the interconnecting cables and the current- and r.r.r.v = - - -
>
t;
t;
tl
carrying components of the equipment through which it
Figure 17.6 The variation of r.r.r.v. with the front time (tl 0~ 2)
15
travels and the leakage capacitance C of such cables and
10 the motor dielectric lumped capacitance etc. (Section
9.6.1). The relation between L and C that will determine
the shape of the travelling wave is known as the surge or
natural impedance 2, of the system and is expressed as:
z, = Et2
W
N (17.2)
where
Time -
L = circuit leakage inductance in henry (H), and
20 C = circuit lumped leakage capacitance in farad (F).
0 0.5 1.0 1.5 2.0 2.5 3.0
(a) Without surge arrester maximum peak to peak Influence of surge impedance on terminal
equipment
voltage = 26 kV
These values (L and C) help to determine the likely surge
15 voltages that may develop during a switching operation
while using different interrupting devices. For accurate
analysis, it is advisable to obtain these values from their
manufacturers. Slamecka (1 980) and others have also
established such curves and have provided them in the
r
form of nomograms for easy identification of this
parameter, as reproduced in Figures 17.7(a) and (b). The
surge impedance Z, varies with variations in the design
parameters, hence from manufacturer to manufacturer.
10 These curves have therefore been provided in the form
of bands. To account for likely variations in the design
15
0 0.5 1.0 1.5 2.0 2.5 3.0 parameters by the different manufacturers one can, at
Time best, obtain an average value of the surge impedance
from these curves for a particular machine, as illustrated
(b) With surge arrester maximum peak to peak for a 500 h.p. (= 500 kVA) motor. But for an accurate
voltage = 13.5 kV
value, it must be obtained from the machine manufacturer
Figure 17.5 Oscillograms showing the effectiveness of a surge alone, as shown in Figure 17.7(c), for curves produced
arrester on a 6.6 kV motor by Siemens for their motors.