
Page 250 - Industrial Ventilation Design Guidebook
P. 250
5.2 HUMAN RESPIRATORY TRACT PHYSIOLOGY 2 i I
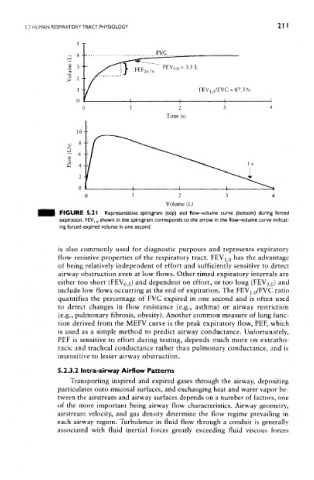
FIGURE 5.21 Representative spirogram (top) and flow-volume curve (bottom) during forced
expiration. FEV, 0 shown in the spirogram corresponds to the arrow in the flow-volume curve indicat-
ing forced expired volume in one second.
is also commonly used for diagnostic purposes and represents expiratory
flow resistive properties of the respiratory tract. FEV 1-0 has the advantage
of being relatively independent of effort and sufficiently sensitive to detect
airway obstruction even at low flows. Other timed expiratory intervals are
either too short (FEV 0 5) and dependent on effort, or too long (FEV 2.o) an ^
include low flows occurring at the end of expiration. The FEVj 0/FVC ratio
quantifies the percentage of FVC expired in one second and is often used
to detect changes in flow resistance (e.g., asthma) or airway restriction
(e.g., pulmonary fibrosis, obesity). Another common measure of lung func-
tion derived from the MEFV curve is the peak expiratory flow, PEF, which
is used as a simple method to predict airway conductance. Unfortunately,
PEF is sensitive to effort during testing, depends much more on extratho-
racic and tracheal conductance rather than pulmonary conductance, and is
insensitive to lesser airway obstruction.
5.2.3.2 Intra-airway Airflow Patterns
Transporting inspired and expired gases through the airway, depositing
particulates onto mucosal surfaces, and exchanging heat and water vapor be-
tween the airstream and airway surfaces depends on a number of factors, one
of the more important being airway flow characteristics. Airway geometry,
airstream velocity, and gas density determine the flow regime prevailing in
each airway region. Turbulence in fluid flow through a conduit is generally
associated with fluid inertial forces greatly exceeding fluid viscous forces