
Page 248 - Industrial Ventilation Design Guidebook
P. 248
5.2 HUMAN RESPIRATORY TRACT PHYSIOLOGY 209
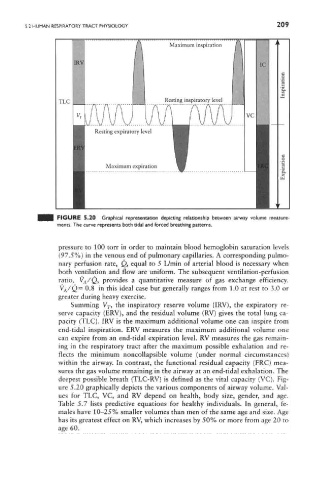
FIGURE 5.20 Graphical representation depicting relationship between airway volume measure-
ments. The curve represents both tidal and forced breathing patterns.
pressure to 100 torr in order to maintain blood hemoglobin saturation levels
(97.5%) in the venous end of pulmonary capillaries. A corresponding pulmo-
nary perfusion rate, Q, equal to 5 L/min of arterial blood is necessary when
both ventilation and flow are uniform. The subsequent ventilation-perfusion
ratio, V A/Q, provides a quantitative measure of gas exchange efficiency.
V A/Q= 0.8 in this ideal case but generally ranges from 1.0 at rest to 3.0 or
greater during heavy exercise.
Summing V T, the inspiratory reserve volume (IRV), the expiratory re-
serve capacity (ERV), and the residual volume (RV) gives the total lung ca-
pacity (TLC). IRV is the maximum additional volume one can inspire from
end-tidal inspiration. ERV measures the maximum additional volume one
can expire from an end-tidal expiration level. RV measures the gas remain-
ing in the respiratory tract after the maximum possible exhalation and re-
flects the minimum noncollapsible volume (under normal circumstances)
within the airway. In contrast, the functional residual capacity (FRC) mea-
sures the gas volume remaining in the airway at an end-tidal exhalation. The
deepest possible breath (TLC-RV) is defined as the vital capacity (VC). Fig-
ure 5.20 graphically depicts the various components of airway volume. Val-
ues for TLC, VC, and RV depend on health, body size, gender, and age.
Table 5.7 lists predictive equations for healthy individuals. In general, fe-
males have 10-25% smaller volumes than men of the same age and size. Age
has its greatest effect on RV, which increases by 50% or more from age 20 to
age 60.