
Page 473 - Industrial Wastewater Treatment, Recycling and Reuse
P. 473
3D TRASAR™ Technologies for Reliable Wastewater Recycling, and Reuse 443
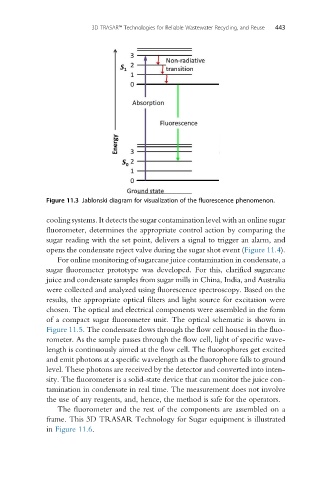
Figure 11.3 Jablonski diagram for visualization of the fluorescence phenomenon.
cooling systems. It detects the sugar contamination level with an online sugar
fluorometer, determines the appropriate control action by comparing the
sugar reading with the set point, delivers a signal to trigger an alarm, and
opens the condensate reject valve during the sugar shot event (Figure 11.4).
For online monitoring of sugarcane juice contamination in condensate, a
sugar fluorometer prototype was developed. For this, clarified sugarcane
juice and condensate samples from sugar mills in China, India, and Australia
were collected and analyzed using fluorescence spectroscopy. Based on the
results, the appropriate optical filters and light source for excitation were
chosen. The optical and electrical components were assembled in the form
of a compact sugar fluorometer unit. The optical schematic is shown in
Figure 11.5. The condensate flows through the flow cell housed in the fluo-
rometer. As the sample passes through the flow cell, light of specific wave-
length is continuously aimed at the flow cell. The fluorophores get excited
and emit photons at a specific wavelength as the fluorophore falls to ground
level. These photons are received by the detector and converted into inten-
sity. The fluorometer is a solid-state device that can monitor the juice con-
tamination in condensate in real time. The measurement does not involve
the use of any reagents, and, hence, the method is safe for the operators.
The fluorometer and the rest of the components are assembled on a
frame. This 3D TRASAR Technology for Sugar equipment is illustrated
in Figure 11.6.