
Page 228 - Information and American Democracy Technology in the Evolution of Political Power
P. 228
P1: IBE/IRP/IQR/IRR
CY101-Bimber
12:12
August 13, 2002
0 521 80067 6
CY101-05
Diffusion of Information Technology among Individuals
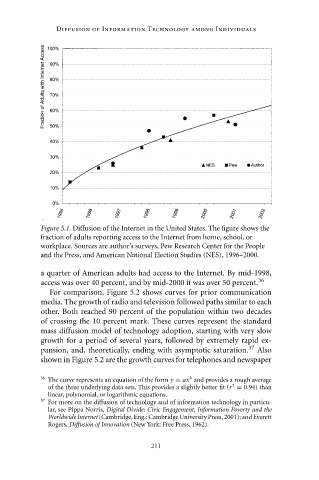
Figure 5.1. Diffusion of the Internet in the United States. The figure shows the
fraction of adults reporting access to the Internet from home, school, or
workplace. Sources are author’s surveys, Pew Research Center for the People
and the Press, and American National Election Studies (NES), 1996–2000.
a quarter of American adults had access to the Internet. By mid-1998,
access was over 40 percent, and by mid-2000 it was over 50 percent. 36
For comparison, Figure 5.2 shows curves for prior communication
media. The growth of radio and television followed paths similar to each
other. Both reached 90 percent of the population within two decades
of crossing the 10 percent mark. These curves represent the standard
mass diffusion model of technology adoption, starting with very slow
growth for a period of several years, followed by extremely rapid ex-
pansion, and, theoretically, ending with asymptotic saturation. 37 Also
shown in Figure 5.2 are the growth curves for telephones and newspaper
36 b
The curve represents an equation of the form y = ax and provides a rough average
2
of the three underlying data sets. This provides a slightly better fit(r = 0.94) than
linear, polynomial, or logarithmic equations.
37
For more on the diffusion of technology and of information technology in particu-
lar, see Pippa Norris, Digital Divide: Civic Engagement, Information Poverty and the
Worldwide Internet (Cambridge, Eng.: Cambridge University Press, 2001); and Everett
Rogers, Diffusion of Innovation (New York: Free Press, 1962).
211