
Page 232 - Information and American Democracy Technology in the Evolution of Political Power
P. 232
P1: IBE/IRP/IQR/IRR
CY101-Bimber
0 521 80067 6
August 13, 2002
CY101-05
12:12
Diffusion of Information Technology among Individuals
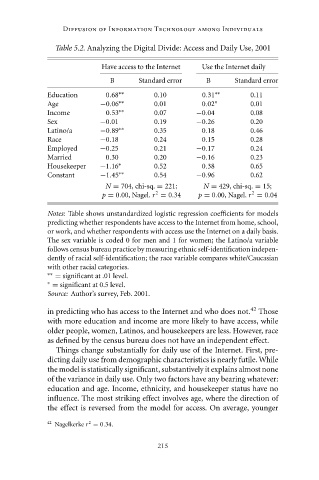
Table 5.2. Analyzing the Digital Divide: Access and Daily Use, 2001
Have access to the Internet Use the Internet daily
B Standard error B Standard error
Education 0.68 ∗∗ 0.10 0.31 ∗∗ 0.11
Age −0.06 ∗∗ 0.01 0.02 ∗ 0.01
Income 0.53 ∗∗ 0.07 −0.04 0.08
Sex −0.01 0.19 −0.26 0.20
Latino/a −0.89 ∗∗ 0.35 0.18 0.46
Race −0.18 0.24 0.15 0.28
Employed −0.25 0.21 −0.17 0.24
Married 0.30 0.20 −0.16 0.23
Housekeeper −1.16 ∗ 0.52 0.38 0.65
Constant −1.45 ∗∗ 0.54 −0.96 0.62
N = 704, chi-sq. = 221; N = 429, chi-sq. = 15;
2
2
p = 0.00, Nagel. r = 0.34 p = 0.00, Nagel. r = 0.04
Notes: Table shows unstandardized logistic regression coefficients for models
predicting whether respondents have access to the Internet from home, school,
or work, and whether respondents with access use the Internet on a daily basis.
The sex variable is coded 0 for men and 1 for women; the Latino/a variable
follows census bureau practice by measuring ethnic self-identification indepen-
dently of racial self-identification; the race variable compares white/Caucasian
with other racial categories.
∗∗ = significant at .01 level.
∗ = significant at 0.5 level.
Source: Author’s survey, Feb. 2001.
in predicting who has access to the Internet and who does not. 42 Those
with more education and income are more likely to have access, while
older people, women, Latinos, and housekeepers are less. However, race
as defined by the census bureau does not have an independent effect.
Things change substantially for daily use of the Internet. First, pre-
dicting daily use from demographic characteristics is nearly futile. While
the model is statistically significant, substantively it explains almost none
of the variance in daily use. Only two factors have any bearing whatever:
education and age. Income, ethnicity, and housekeeper status have no
influence. The most striking effect involves age, where the direction of
the effect is reversed from the model for access. On average, younger
42 2
Nagelkerke r = 0.34.
215