
Page 237 - Information and American Democracy Technology in the Evolution of Political Power
P. 237
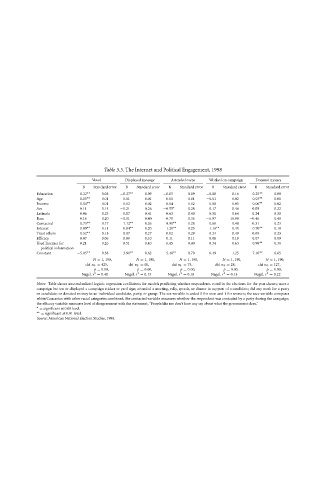
Table 5.5. The Internet and Political Engagement, 1998       CY101-05  0 521 80067 6  P1: IBE/IRP/IQR/IRR
                          Voted    Displayed message  Attended event  Worked on campaign  Donated money
                       B  Standard error  B  Standard error  B  Standard error  B  Standard error  B  Standard error
           Education   0.22 ∗∗  0.05  −0.27 ∗∗  0.09  −0.03  0.09  −0.08  0.16  0.25 ∗∗  0.08
           Age         0.05 ∗∗  0.01  0.01  0.01  0.00  0.01  −0.01  0.02  0.03 ∗∗  0.01
           Income      0.04 ∗∗  0.01  0.03  0.02  0.04  0.02  0.08  0.05  0.06 ∗∗  0.02
           Sex         0.11  0.14  −0.21  0.26  −0.55 ∗  0.28  0.17  0.46  0.09  0.22     CY101-Bimber
           Latino/a    0.06  0.23  0.07  0.41  0.63  0.40  0.50  0.64  0.24  0.38
           Race        0.16  0.20  −0.01  0.40  0.70  0.36  −6.97  19.98  −0.46  0.40
           Contacted   0.75 ∗∗  0.17  1.12 ∗∗  0.26  0.90 ∗∗  0.28  0.69  0.48  0.31  0.23
           Interest    0.89 ∗∗  0.11  0.84 ∗∗  0.20  1.20 ∗∗  0.23  1.16 ∗∗  0.40  0.70 ∗∗  0.18
           Trust others  0.52 ∗∗  0.15  0.07  0.27  0.02  0.29  0.24  0.49  0.09  0.23
           Efficacy     0.07  0.06  0.09  0.10  0.11  0.11  −0.08  0.19  0.07  0.09
           Used Internet for  0.21  0.26  0.51  0.40  0.45  0.40  0.34  0.63  0.98 ∗∗  0.30  August 13, 2002
            political information
 220
           Constant   −5.05 ∗∗  0.38  −3.91 ∗∗  0.62  −5.48 ∗∗  0.70  −6.49  1.25  −7.10 ∗∗  0.65
                          N = 1, 190,  N = 1, 190,  N = 1, 190,  N = 1, 190,  N = 1, 190,
                        chi-sq. = 425,  chi-sq. = 60,  chi-sq. = 75,  chi-sq. = 28,  chi-sq. = 127,
                          p = 0.00,   p = 0.00,   p = 0.00,  p = 0.00,   p = 0.00,
                       Nagel. r 2 = 0.40  Nagel. r 2 = 0.13  Nagel. r 2 = 0.18  Nagel. r 2 = 0.15  Nagel. r 2 = 0.22  12:12
           Notes: Table shows unstandardized logistic regression coefficients for models predicting whether respondents voted in the elections for the year shown; wore a
           campaign button or displayed a campaign sticker or yard sign; attended a meeting, rally, speech, or dinner in support of a candidate; did any work for a party
           or candidate; or donated money to an individual candidate, party, or group. The sex variable is coded 0 for men and 1 for women; the race variable compares
           white/Caucasian with other racial categories combined; the contacted variable measures whether the respondent was contacted by a party during the campaign;
           the efficacy variable measures level of disagreement with the statement, “People like me don’t have any say about what the government does.”
           ∗ = significant at 0.05 level.
           ∗∗ = significant at 0.01 level.
           Source: American National Election Studies, 1998.