
Page 235 - Information and American Democracy Technology in the Evolution of Political Power
P. 235
P1: IBE/IRP/IQR/IRR
CY101-Bimber
August 13, 2002
CY101-05
0 521 80067 6
Political Individuals 12:12
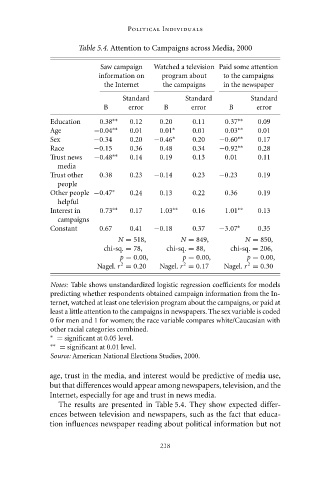
Table 5.4. Attention to Campaigns across Media, 2000
Saw campaign Watched a television Paid some attention
information on program about to the campaigns
the Internet the campaigns in the newspaper
Standard Standard Standard
B error B error B error
Education 0.38 ∗∗ 0.12 0.20 0.11 0.37 ∗∗ 0.09
Age −0.04 ∗∗ 0.01 0.01 ∗ 0.01 0.03 ∗∗ 0.01
Sex −0.34 0.20 −0.46 ∗ 0.20 −0.60 ∗∗ 0.17
Race −0.15 0.36 0.48 0.34 −0.92 ∗∗ 0.28
Trust news −0.48 ∗∗ 0.14 0.19 0.13 0.01 0.11
media
Trust other 0.38 0.23 −0.14 0.23 −0.23 0.19
people
Other people −0.47 ∗ 0.24 0.13 0.22 0.36 0.19
helpful
Interest in 0.73 ∗∗ 0.17 1.03 ∗∗ 0.16 1.01 ∗∗ 0.13
campaigns
Constant 0.67 0.41 −0.18 0.37 −3.07 ∗ 0.35
N = 518, N = 849, N = 850,
chi-sq. = 78, chi-sq. = 88, chi-sq. = 206,
p = 0.00, p = 0.00, p = 0.00,
2
2
2
Nagel. r = 0.20 Nagel. r = 0.17 Nagel. r = 0.30
Notes: Table shows unstandardized logistic regression coefficients for models
predicting whether respondents obtained campaign information from the In-
ternet, watched at least one television program about the campaigns, or paid at
least a little attention to the campaigns in newspapers. The sex variable is coded
0 for men and 1 for women; the race variable compares white/Caucasian with
other racial categories combined.
= significant at 0.05 level.
∗
∗∗
= significant at 0.01 level.
Source: American National Elections Studies, 2000.
age, trust in the media, and interest would be predictive of media use,
but that differences would appear among newspapers, television, and the
Internet, especially for age and trust in news media.
The results are presented in Table 5.4. They show expected differ-
ences between television and newspapers, such as the fact that educa-
tion influences newspaper reading about political information but not
218