
Page 27 - Injection Molding Advanced Troubleshooting Guide
P. 27
8 1 Troubleshooting Methodology
Figure 1.1 4M Basic 8
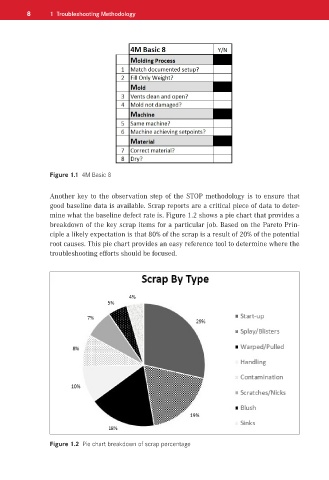
Another key to the observation step of the STOP methodology is to ensure that
good baseline data is available. Scrap reports are a critical piece of data to deter-
mine what the baseline defect rate is. Figure 1.2 shows a pie chart that provides a
breakdown of the key scrap items for a particular job. Based on the Pareto Prin-
ciple a likely expectation is that 80% of the scrap is a result of 20% of the potential
root causes. This pie chart provides an easy reference tool to determine where the
troubleshooting efforts should be focused.
Figure 1.2 Pie chart breakdown of scrap percentage