
Page 125 - Inorganic Mass Spectrometry - Fundamentals and Applications
P. 125
Ind~ctivel~ ~oupled Plasma Mass Spectrometry 115
l I l
a 1.00 2 1.00
;7j 0.80
P
2 0.60
.-
0.40 g 0.40
0.20 g 0.20
0.00 0.00
0 0
Barrel lens voltage (v) Plate lens voltage (v)
__ 1.00
._.
& 0.30
m
$ 0.60
.-
v
5 0.40
U
0.20
3 4 5 6 7 3 9 1 0
Lens voltage (V)
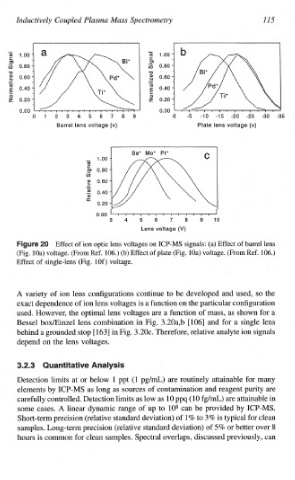
Effect of ion optic lens voltages on ICP-MS signals: (a) Effect of barrel lens
(Fig. loa) voltage. (From Ref. 106.) (b) Effect of plate (Fig. loa) voltage. (From Ref. 106.)
Effect of single-lens (Fig. 10f) voltage.
A variety of ion lens configurations continue to be developed and used, so the
exact dependence of ion lens voltages is a function on the particular configuration
used. However, the optimal lens voltages are a function of mass, as shown for a
Bessel boxkiinzel lens combination in Fig. 3.20a,b E1061 and for a single lens
behind a grounded stop [ 1631 in Fig. 3.20~. Therefore, relative analyte ion signals
depend on the lens voltages.
Detection limits at or below 1 ppt (l pg/d) are routinely attainable for many
elements by ICP-MS as long as sources of conta~nation and reagent purity are
carefully controlled. Detection limits as low as 10 ppq (10 fglml) are attainab
some cases. A linear dynamic range of up to 108 can be provided by ICP-
of
Short-term precision (relative standard deviation) 1 % to 3% is typical for clean
of 5% or better over 8
samples. Long-term precision (relative standard deviation)
hours is common for clean samples. Spectral overlaps, discussed previously, can