
Page 278 - Inorganic Mass Spectrometry - Fundamentals and Applications
P. 278
264 Marcus
of
all evaluated the role of metal matrix material on the performance GD-MS ion
sources. The choice of binder material is dictated by a combination of the sample
disk's robustness, sample sputtering rate (affecting analyte signal intensity), abil-
air (i.e., gettering
ity to remove unwanted residual gases such as water vapor and
quality), binder purity, and possible isobaric interferences with target analytes.
A pair of papers from the Harrison laboratory form the most comprehensive
body of work dealing with the use of the compaction methodologies in GD-MS.
Tong and Harrison evaluated six different matrix materials: graphite, Ag, Al, Cu,
Fe, and Ta. Going through the matrices, some generalities about each matrix can
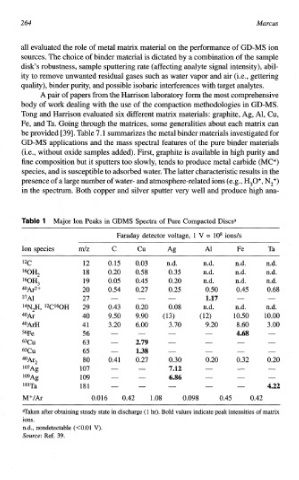
be provided 1391. Table 7.1 summarizes the metal binder materials investigated for
GD-MS applications and the mass spectral features of the pure binder materials
(i.e., without oxide samples added). First, graphite is available in high purity and
fine composition but it sputters too slowly, tends to produce metal carbide (MCf)
species, and is susceptible to adsorbed water. The latter characteristic results in the
presence of a large number of water- and atmosphe~e-related ions (e.g., H,O+, NZ+)
in the spectrum. Both copper and silver sputter very well and produce high ana-
le l Major Ion Peaks in GDMS Spectra of Pure Compacted Discsa
Faraday detector voltage, 1 V = lo8 ion&
Ion species d Z C cu Ag A1 Fe Ta
'2C 12 0.15 0.03 n.d. m.d. n,d. n.d.
l60H2 18 0.20 0.58 0.35 n.d. n.d. n.d.
160H3 19 0.05 0.45 0.20 n.d. n.d, n.d.
40&2+ 20 0.54 0.27 0.25 0.50 0.45 0.68
27~1 27 - - - x.27 - -
14N2H, 12C160H 29 0.43 0.20 0.08 n.d. n,d. ad.
40Ar 40 9.50 9.90 (13) (12) 10.50 10.00
4OArH 41 3.20 6.00 3.70 9.20 8.60 3.00
56Fe 56 - - - 4.68 -
63Cu 63 - 2.79 - - _. -
65Cu 65 - 1.38 - - - -
4oAr2 80 0.41 0.27 0.30 0.20 0.32 0.20
l07Ag 107 - - 7.12 - - -
lo9Ag 109 - - 6.86 - - __.
l*lTa 181 - - - - - 4.22
h€+/& 0.016 0.42 1.08 0.098 0.45 0.42
Taken after obtaining steady state in discharge hr). Bold values indicate peak intensities of matrix
(1
ions.
n.d., nondetectable (KO.01 V).
Source: Ref. 39.