
Page 285 - Inorganic Mass Spectrometry - Fundamentals and Applications
P. 285
Analysis of Noncond~c~ive Sample Types 271
In addition to the need to obtain a proper overlayer thickness for optimal sample
sputtering, there is another consideration involving the relative amounts of ion sig-
nal derived from the sample and cathode species. In short, it is desirable to have
the highest possible analyte signal intensity, while ~ni~zing the contributions
from possible conta~nants in the secondary cathode. Therefore, the ratio of the
analyte-to-cathode matrix ion signals is an important quantity. Both groups have
evaluated the respective roles of the limiting anode diameter (which determines
of
the total sputtering area) and the inner diameter the secondary cathode (which
determines the relative sputtering areas of the cathode and the sample). In addition
of
to establishing stable discharges and minimizing the relative contribution cath-
ode species, the exposed area of the sample adds a temporal component, as large
exposed areas require longer times for coverage. Conversely, very small regions
tend to cover quickly to the point of forrning too thick a metallic overlayer.
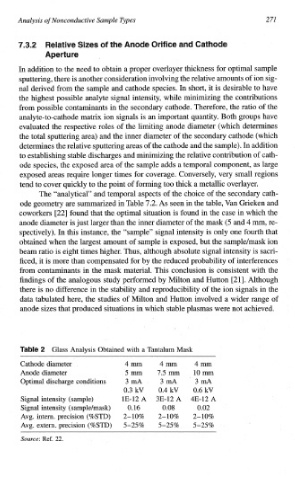
The “analytical” and temporal aspects of the choice of the secondary cath-
Van
ode geometry are summarized in Table 7.2. As seen in the table, Grieken and
coworkers [22] found that the optimal situation is found in the case in which the
of
anode diameter is just larger than the inner diameter the mask (5 and 4 m, re-
spectively). In this instance, the “sample” signal intensity is only one fourth that
obtained when the largest amount of sample is exposed, but the samplelmask ion
beam ratio is eight times higher. Thus, although absolute signal intensity is sacri-
ficed, it is more than compensated for by the reduced probability of interferences
from cont~nants in the mask material. This conclusion is consistent with the
findings of the analogous study performed by Milton and Hutton [21]. Although
there is no difference in the stability and reproducibility of the ion signals in the
data tabulated here, the studies of Milton and Hutton involved a wider range of
anode sizes that produced situations in which stable plasmas were not achieved.
Glass Analysis Obtained with a Tantalum Mask
Cathode diameter 4mm 4mm 4mm
Anode diameter 5 mm 7.5 mm 10 mm
Optimal discharge conditions 3 mA 3 mA 3 mA
0.3 kV 0.4 kV 0.6 kV
Signal intensity (sample) 1E-12 A 3E-12 A 4E-12 A
Signal intensity (samplelmask) 0.16 0.08 0.02
Avg. intern. precision (%STD) 2-10% 2-10% 2-10%
Avg. extern. precision (%STD) 5-25% 5-2596 5-25%
Source: Ref. 22.