
Page 213 - Instant notes
P. 213
The kinetics of real systems 199
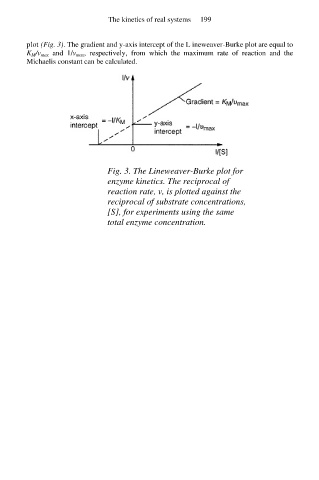
plot (Fig. 3). The gradient and y-axis intercept of the L ineweaver-Burke plot are equal to
K M/v max and 1/v max, respectively, from which the maximum rate of reaction and the
Michaelis constant can be calculated.
Fig. 3. The Lineweaver-Burke plot for
enzyme kinetics. The reciprocal of
reaction rate, v, is plotted against the
reciprocal of substrate concentrations,
[S], for experiments using the same
total enzyme concentration.