
Page 105 - Solutions Manual to accompany Electric Machinery Fundamentals
P. 105
Pload = 0:10:300; % Load in MW
% Calculate the system frequency
fsys = (10421 - Pload) ./ 170.96;
% Calculate the power of each generator
PA = spA .* ( fnlA - fsys);
PB = spB .* ( fnlB - fsys);
PC = spC .* ( fnlC - fsys);
% Plot the power sharing versus load
plot(Pload,PA,'b-','LineWidth',2.0);
hold on;
plot(Pload,PB,'k--','LineWidth',2.0);
plot(Pload,PC,'r-.','LineWidth',2.0);
plot([0 300],[100 100],'k','LineWidth',1.0);
plot([0 300],[0 0],'k:');
title ('\bfPower Sharing Versus Total Load');
xlabel ('\bfTotal Load (MW)');
ylabel ('\bfGenerator Power (MW)');
legend('Generator A','Generator B','Generator C','Power Limit');
grid on;
hold off;
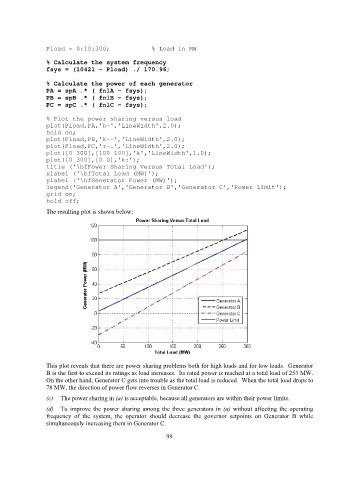
The resulting plot is shown below:
This plot reveals that there are power sharing problems both for high loads and for low loads. Generator
B is the first to exceed its ratings as load increases. Its rated power is reached at a total load of 253 MW.
On the other hand, Generator C gets into trouble as the total load is reduced. When the total load drops to
78 MW, the direction of power flow reverses in Generator C.
(c) The power sharing in (a) is acceptable, because all generators are within their power limits.
(d) To improve the power sharing among the three generators in (a) without affecting the operating
frequency of the system, the operator should decrease the governor setpoints on Generator B while
simultaneously increasing them in Generator C.
99